Analysis of 2007 Emissions from Power Plants and Other ... - MARAMA
Analysis of 2007 Emissions from Power Plants and Other ... - MARAMA
Analysis of 2007 Emissions from Power Plants and Other ... - MARAMA

You also want an ePaper? Increase the reach of your titles
YUMPU automatically turns print PDFs into web optimized ePapers that Google loves.
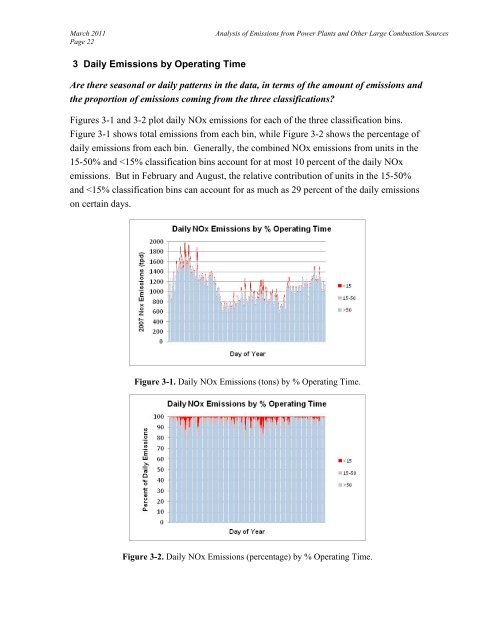
March 2011Page 22<strong>Analysis</strong> <strong>of</strong> <strong>Emissions</strong> <strong>from</strong> <strong>Power</strong> <strong>Plants</strong> <strong>and</strong> <strong>Other</strong> Large Combustion Sources3 Daily <strong>Emissions</strong> by Operating TimeAre there seasonal or daily patterns in the data, in terms <strong>of</strong> the amount <strong>of</strong> emissions <strong>and</strong>the proportion <strong>of</strong> emissions coming <strong>from</strong> the three classifications?Figures 3-1 <strong>and</strong> 3-2 plot daily NOx emissions for each <strong>of</strong> the three classification bins.Figure 3-1 shows total emissions <strong>from</strong> each bin, while Figure 3-2 shows the percentage <strong>of</strong>daily emissions <strong>from</strong> each bin. Generally, the combined NOx emissions <strong>from</strong> units in the15-50% <strong>and</strong>