Analysis of 2007 Emissions from Power Plants and Other ... - MARAMA
Analysis of 2007 Emissions from Power Plants and Other ... - MARAMA
Analysis of 2007 Emissions from Power Plants and Other ... - MARAMA

You also want an ePaper? Increase the reach of your titles
YUMPU automatically turns print PDFs into web optimized ePapers that Google loves.
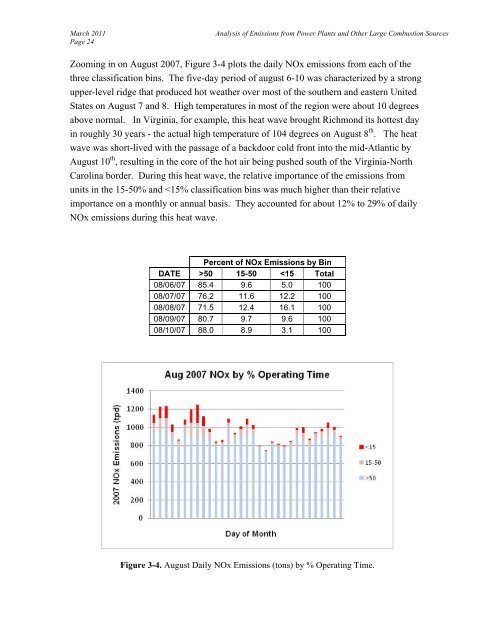
March 2011Page 24<strong>Analysis</strong> <strong>of</strong> <strong>Emissions</strong> <strong>from</strong> <strong>Power</strong> <strong>Plants</strong> <strong>and</strong> <strong>Other</strong> Large Combustion SourcesZooming in on August <strong>2007</strong>, Figure 3-4 plots the daily NOx emissions <strong>from</strong> each <strong>of</strong> thethree classification bins. The five-day period <strong>of</strong> august 6-10 was characterized by a strongupper-level ridge that produced hot weather over most <strong>of</strong> the southern <strong>and</strong> eastern UnitedStates on August 7 <strong>and</strong> 8. High temperatures in most <strong>of</strong> the region were about 10 degreesabove normal. In Virginia, for example, this heat wave brought Richmond its hottest dayin roughly 30 years - the actual high temperature <strong>of</strong> 104 degrees on August 8 th . The heatwave was short-lived with the passage <strong>of</strong> a backdoor cold front into the mid-Atlantic byAugust 10 th , resulting in the core <strong>of</strong> the hot air being pushed south <strong>of</strong> the Virginia-NorthCarolina border. During this heat wave, the relative importance <strong>of</strong> the emissions <strong>from</strong>units in the 15-50% <strong>and</strong> 50 15-50