Analysis of 2007 Emissions from Power Plants and Other ... - MARAMA
Analysis of 2007 Emissions from Power Plants and Other ... - MARAMA
Analysis of 2007 Emissions from Power Plants and Other ... - MARAMA
Create successful ePaper yourself
Turn your PDF publications into a flip-book with our unique Google optimized e-Paper software.
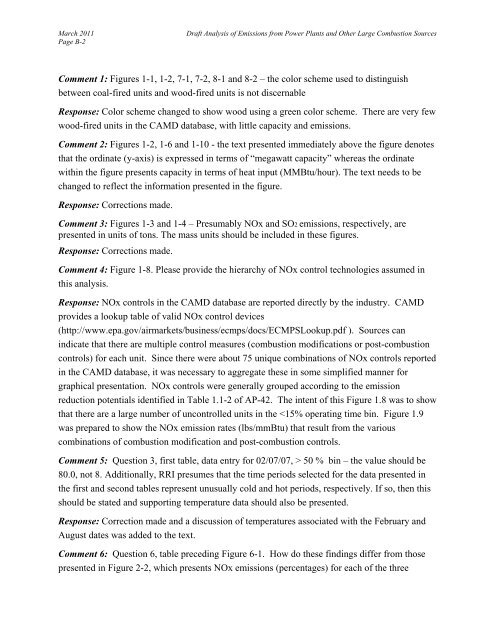
March 2011Page B-2Draft <strong>Analysis</strong> <strong>of</strong> <strong>Emissions</strong> <strong>from</strong> <strong>Power</strong> <strong>Plants</strong> <strong>and</strong> <strong>Other</strong> Large Combustion SourcesComment 1: Figures 1-1, 1-2, 7-1, 7-2, 8-1 <strong>and</strong> 8-2 – the color scheme used to distinguishbetween coal-fired units <strong>and</strong> wood-fired units is not discernableResponse: Color scheme changed to show wood using a green color scheme. There are very fewwood-fired units in the CAMD database, with little capacity <strong>and</strong> emissions.Comment 2: Figures 1-2, 1-6 <strong>and</strong> 1-10 - the text presented immediately above the figure denotesthat the ordinate (y-axis) is expressed in terms <strong>of</strong> “megawatt capacity” whereas the ordinatewithin the figure presents capacity in terms <strong>of</strong> heat input (MMBtu/hour). The text needs to bechanged to reflect the information presented in the figure.Response: Corrections made.Comment 3: Figures 1-3 <strong>and</strong> 1-4 – Presumably NOx <strong>and</strong> SO2 emissions, respectively, arepresented in units <strong>of</strong> tons. The mass units should be included in these figures.Response: Corrections made.Comment 4: Figure 1-8. Please provide the hierarchy <strong>of</strong> NOx control technologies assumed inthis analysis.Response: NOx controls in the CAMD database are reported directly by the industry. CAMDprovides a lookup table <strong>of</strong> valid NOx control devices(http://www.epa.gov/airmarkets/business/ecmps/docs/ECMPSLookup.pdf ). Sources canindicate that there are multiple control measures (combustion modifications or post-combustioncontrols) for each unit. Since there were about 75 unique combinations <strong>of</strong> NOx controls reportedin the CAMD database, it was necessary to aggregate these in some simplified manner forgraphical presentation. NOx controls were generally grouped according to the emissionreduction potentials identified in Table 1.1-2 <strong>of</strong> AP-42. The intent <strong>of</strong> this Figure 1.8 was to showthat there are a large number <strong>of</strong> uncontrolled units in the 50 % bin – the value should be80.0, not 8. Additionally, RRI presumes that the time periods selected for the data presented inthe first <strong>and</strong> second tables represent unusually cold <strong>and</strong> hot periods, respectively. If so, then thisshould be stated <strong>and</strong> supporting temperature data should also be presented.Response: Correction made <strong>and</strong> a discussion <strong>of</strong> temperatures associated with the February <strong>and</strong>August dates was added to the text.Comment 6: Question 6, table preceding Figure 6-1. How do these findings differ <strong>from</strong> thosepresented in Figure 2-2, which presents NOx emissions (percentages) for each <strong>of</strong> the three


