Analysis of 2007 Emissions from Power Plants and Other ... - MARAMA
Analysis of 2007 Emissions from Power Plants and Other ... - MARAMA
Analysis of 2007 Emissions from Power Plants and Other ... - MARAMA
Create successful ePaper yourself
Turn your PDF publications into a flip-book with our unique Google optimized e-Paper software.
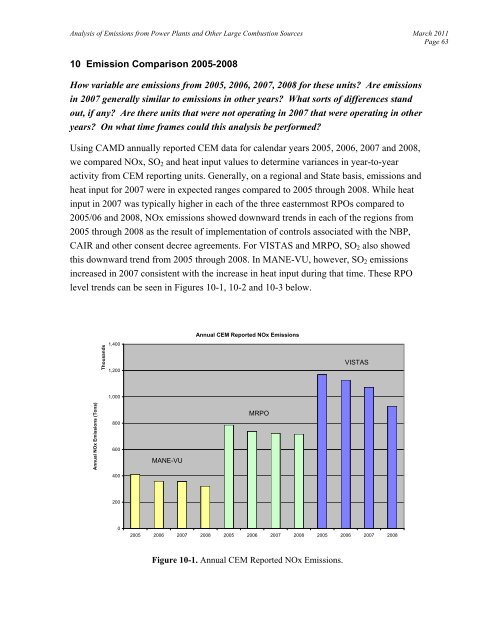
<strong>Analysis</strong> <strong>of</strong> <strong>Emissions</strong> <strong>from</strong> <strong>Power</strong> <strong>Plants</strong> <strong>and</strong> <strong>Other</strong> Large Combustion Sources March 2011Page 6310 Emission Comparison 2005-2008How variable are emissions <strong>from</strong> 2005, 2006, <strong>2007</strong>, 2008 for these units? Are emissionsin <strong>2007</strong> generally similar to emissions in other years? What sorts <strong>of</strong> differences st<strong>and</strong>out, if any? Are there units that were not operating in <strong>2007</strong> that were operating in otheryears? On what time frames could this analysis be performed?Using CAMD annually reported CEM data for calendar years 2005, 2006, <strong>2007</strong> <strong>and</strong> 2008,we compared NOx, SO 2 <strong>and</strong> heat input values to determine variances in year-to-yearactivity <strong>from</strong> CEM reporting units. Generally, on a regional <strong>and</strong> State basis, emissions <strong>and</strong>heat input for <strong>2007</strong> were in expected ranges compared to 2005 through 2008. While heatinput in <strong>2007</strong> was typically higher in each <strong>of</strong> the three easternmost RPOs compared to2005/06 <strong>and</strong> 2008, NOx emissions showed downward trends in each <strong>of</strong> the regions <strong>from</strong>2005 through 2008 as the result <strong>of</strong> implementation <strong>of</strong> controls associated with the NBP,CAIR <strong>and</strong> other consent decree agreements. For VISTAS <strong>and</strong> MRPO, SO 2 also showedthis downward trend <strong>from</strong> 2005 through 2008. In MANE-VU, however, SO 2 emissionsincreased in <strong>2007</strong> consistent with the increase in heat input during that time. These RPOlevel trends can be seen in Figures 10-1, 10-2 <strong>and</strong> 10-3 below.Thous<strong>and</strong>s1,4001,200Annual CEM Reported NOx <strong>Emissions</strong>VISTAS1,000Annual NOx <strong>Emissions</strong> (Tons)800600MANE-VUMRPO40020002005 2006 <strong>2007</strong> 2008 2005 2006 <strong>2007</strong> 2008 2005 2006 <strong>2007</strong> 2008Figure 10-1. Annual CEM Reported NOx <strong>Emissions</strong>.


