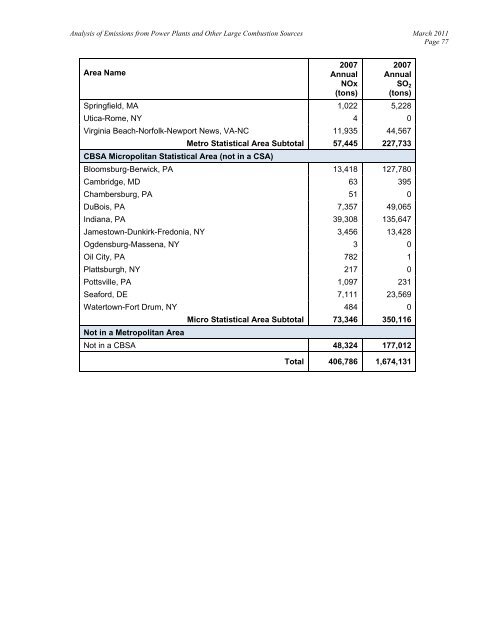
March 2011Page 76<strong>Analysis</strong> <strong>of</strong> <strong>Emissions</strong> <strong>from</strong> <strong>Power</strong> <strong>Plants</strong> <strong>and</strong> <strong>Other</strong> Large Combustion SourcesTable 11-1. Annual NOx <strong>and</strong> SO 2 <strong>Emissions</strong> <strong>from</strong> CAMD Units by Metropolitan Area.Area Name<strong>2007</strong>AnnualNOx(tons)<strong>2007</strong>AnnualSO 2(tons)Combined Statistical Area (CSA)Albany-Schenectady-Amsterdam, NY 5,797 8Boston-Worcester-Manchester, MA-RI-NH 14,292 84,494Buffalo-Niagara-Cattaraugus, NY 8,105 15,419Harrisburg-Carlisle-Lebanon, PA 140 5Hartford-West Hartford-Willimantic, CT 1,024 522Ithaca-Cortl<strong>and</strong>, NY 2,575 3,660Johnson City-Kingsport-Bristol (Tri-Cities), TN-VA 73 1New York-Newark-Bridgeport, NY-NJ-CT-PA 35,385 63,486Philadelphia-Camden-Vinel<strong>and</strong>, PA-NJ-DE-MD 23,145 36,759Pittsburgh-New Castle, PA 56,055 280,623Portl<strong>and</strong>-Lewiston-South Portl<strong>and</strong>, ME 387 1,659Rochester-Batavia-Seneca Falls, NY 5,358 21,719Sunbury-Lewisburg-Selinsgrove, PA 4,061 30,309Syracuse-Auburn, NY 1,626 1,482Washington-Baltimore-Northern Virginia, DC-MD-VA-WV 52,181 272,974York-Hanover-Gettysburg, PA 17,467 106,151CBSA Metropolitan Statistical Areas (not in a CSA)CSA Subtotal 227,671 919,271Allentown-Bethlehem-Easton, PA-NJ 8,310 47,719Bangor, ME 102 4Barnstable Town, MA 1,057 6,675Binghamton, NY 949 7,931Blacksburg-Christiansburg-Radford, VA 3,451 11,491Burlington-South Burlington, VT 377 6Charlottesville, VA 3,540 10,456Cumberl<strong>and</strong>, MD-WV 3,978 0Dover, DE 553 99Hagerstown-Martinsburg, MD-WV 1,398 5,536Johnstown, PA 2,134 0Lynchburg, VA 611 80Norwich-New London, CT 913 127Ocean City, NJ 4,376 12,733Pittsfield, MA 10 0Richmond, VA 11,821 71,408Scranton--Wilkes-Barre, PA 907 3,674
<strong>Analysis</strong> <strong>of</strong> <strong>Emissions</strong> <strong>from</strong> <strong>Power</strong> <strong>Plants</strong> <strong>and</strong> <strong>Other</strong> Large Combustion Sources March 2011Page 77Area Name<strong>2007</strong>AnnualNOx(tons)<strong>2007</strong>AnnualSO 2(tons)Springfield, MA 1,022 5,228Utica-Rome, NY 4 0Virginia Beach-Norfolk-Newport News, VA-NC 11,935 44,567Metro Statistical Area Subtotal 57,445 227,733CBSA Micropolitan Statistical Area (not in a CSA)Bloomsburg-Berwick, PA 13,418 127,780Cambridge, MD 63 395Chambersburg, PA 51 0DuBois, PA 7,357 49,065Indiana, PA 39,308 135,647Jamestown-Dunkirk-Fredonia, NY 3,456 13,428Ogdensburg-Massena, NY 3 0Oil City, PA 782 1Plattsburgh, NY 217 0Pottsville, PA 1,097 231Seaford, DE 7,111 23,569Watertown-Fort Drum, NY 484 0Micro Statistical Area Subtotal 73,346 350,116Not in a Metropolitan AreaNot in a CBSA 48,324 177,012Total 406,786 1,674,131