Analysis of 2007 Emissions from Power Plants and Other ... - MARAMA
Analysis of 2007 Emissions from Power Plants and Other ... - MARAMA
Analysis of 2007 Emissions from Power Plants and Other ... - MARAMA

You also want an ePaper? Increase the reach of your titles
YUMPU automatically turns print PDFs into web optimized ePapers that Google loves.
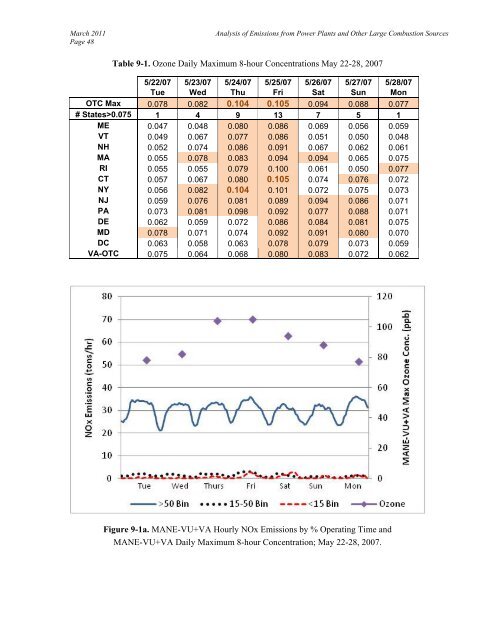
March 2011Page 48<strong>Analysis</strong> <strong>of</strong> <strong>Emissions</strong> <strong>from</strong> <strong>Power</strong> <strong>Plants</strong> <strong>and</strong> <strong>Other</strong> Large Combustion SourcesTable 9-1. Ozone Daily Maximum 8-hour Concentrations May 22-28, <strong>2007</strong>5/22/07 5/23/07 5/24/07 5/25/07 5/26/07 5/27/07 5/28/07Tue Wed Thu Fri Sat Sun MonOTC Max 0.078 0.082 0.104 0.105 0.094 0.088 0.077# States>0.075 1 4 9 13 7 5 1ME 0.047 0.048 0.080 0.086 0.069 0.056 0.059VT 0.049 0.067 0.077 0.086 0.051 0.050 0.048NH 0.052 0.074 0.086 0.091 0.067 0.062 0.061MA 0.055 0.078 0.083 0.094 0.094 0.065 0.075RI 0.055 0.055 0.079 0.100 0.061 0.050 0.077CT 0.057 0.067 0.080 0.105 0.074 0.076 0.072NY 0.056 0.082 0.104 0.101 0.072 0.075 0.073NJ 0.059 0.076 0.081 0.089 0.094 0.086 0.071PA 0.073 0.081 0.098 0.092 0.077 0.088 0.071DE 0.062 0.059 0.072 0.086 0.084 0.081 0.075MD 0.078 0.071 0.074 0.092 0.091 0.080 0.070DC 0.063 0.058 0.063 0.078 0.079 0.073 0.059VA-OTC 0.075 0.064 0.068 0.080 0.083 0.072 0.062Figure 9-1a. MANE-VU+VA Hourly NOx <strong>Emissions</strong> by % Operating Time <strong>and</strong>MANE-VU+VA Daily Maximum 8-hour Concentration; May 22-28, <strong>2007</strong>.