Analysis of 2007 Emissions from Power Plants and Other ... - MARAMA
Analysis of 2007 Emissions from Power Plants and Other ... - MARAMA
Analysis of 2007 Emissions from Power Plants and Other ... - MARAMA

You also want an ePaper? Increase the reach of your titles
YUMPU automatically turns print PDFs into web optimized ePapers that Google loves.
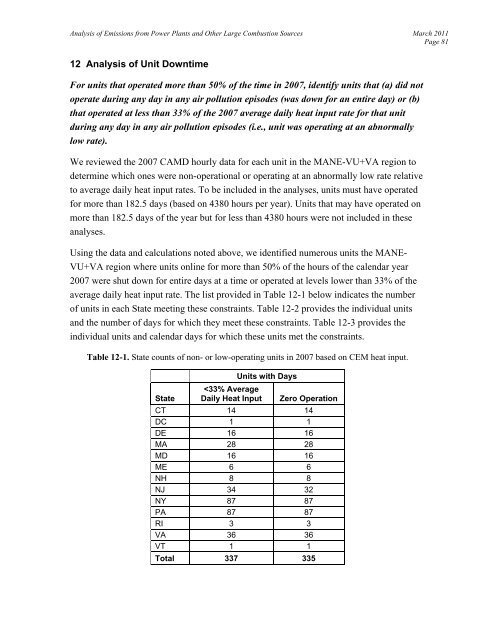
<strong>Analysis</strong> <strong>of</strong> <strong>Emissions</strong> <strong>from</strong> <strong>Power</strong> <strong>Plants</strong> <strong>and</strong> <strong>Other</strong> Large Combustion Sources March 2011Page 8112 <strong>Analysis</strong> <strong>of</strong> Unit DowntimeFor units that operated more than 50% <strong>of</strong> the time in <strong>2007</strong>, identify units that (a) did notoperate during any day in any air pollution episodes (was down for an entire day) or (b)that operated at less than 33% <strong>of</strong> the <strong>2007</strong> average daily heat input rate for that unitduring any day in any air pollution episodes (i.e., unit was operating at an abnormallylow rate).We reviewed the <strong>2007</strong> CAMD hourly data for each unit in the MANE-VU+VA region todetermine which ones were non-operational or operating at an abnormally low rate relativeto average daily heat input rates. To be included in the analyses, units must have operatedfor more than 182.5 days (based on 4380 hours per year). Units that may have operated onmore than 182.5 days <strong>of</strong> the year but for less than 4380 hours were not included in theseanalyses.Using the data <strong>and</strong> calculations noted above, we identified numerous units the MANE-VU+VA region where units online for more than 50% <strong>of</strong> the hours <strong>of</strong> the calendar year<strong>2007</strong> were shut down for entire days at a time or operated at levels lower than 33% <strong>of</strong> theaverage daily heat input rate. The list provided in Table 12-1 below indicates the number<strong>of</strong> units in each State meeting these constraints. Table 12-2 provides the individual units<strong>and</strong> the number <strong>of</strong> days for which they meet these constraints. Table 12-3 provides theindividual units <strong>and</strong> calendar days for which these units met the constraints.Table 12-1. State counts <strong>of</strong> non- or low-operating units in <strong>2007</strong> based on CEM heat input.State