Annual report 2011 - Trelleborg
Annual report 2011 - Trelleborg
Annual report 2011 - Trelleborg

Create successful ePaper yourself
Turn your PDF publications into a flip-book with our unique Google optimized e-Paper software.
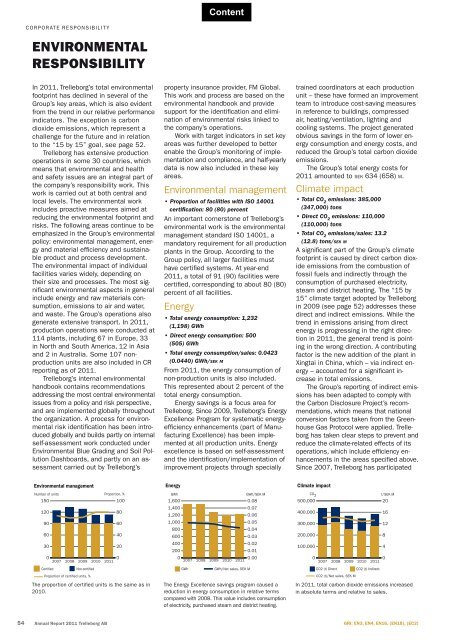
54<br />
CORPORATE RESPONSIBILITY<br />
ENVIRONMENTAL<br />
RESPONSIBILITY<br />
In <strong>2011</strong>, <strong>Trelleborg</strong>’s total environmental<br />
footprint has declined in several of the<br />
Group’s key areas, which is also evident<br />
from the trend in our relative performance<br />
indicators. The exception is carbon<br />
dioxide emissions, which represent a<br />
challenge for the future and in relation<br />
to the “15 by 15” goal, see page 52.<br />
<strong>Trelleborg</strong> has extensive production<br />
operations in some 30 countries, which<br />
means that environmental and health<br />
and safety issues are an integral part of<br />
the company’s responsibility work. This<br />
work is carried out at both central and<br />
local levels. The environmental work<br />
includes proactive measures aimed at<br />
reducing the environmental footprint and<br />
risks. The following areas continue to be<br />
emphasized in the Group’s environmental<br />
policy: environmental management, energy<br />
and material effi ciency and sustainable<br />
product and process development.<br />
The environmental impact of individual<br />
facilities varies widely, depending on<br />
their size and processes. The most signifi<br />
cant environmental aspects in general<br />
include energy and raw materials consumption,<br />
emissions to air and water,<br />
and waste. The Group’s operations also<br />
generate extensive transport. In <strong>2011</strong>,<br />
production operations were conducted at<br />
114 plants, including 67 in Europe, 33<br />
in North and South America, 12 in Asia<br />
and 2 in Australia. Some 107 nonproduction<br />
units are also included in CR<br />
<strong>report</strong>ing as of <strong>2011</strong>.<br />
<strong>Trelleborg</strong>’s internal environmental<br />
handbook contains recommendations<br />
addressing the most central environmental<br />
issues from a policy and risk perspective,<br />
and are implemented globally throughout<br />
the organization. A process for environmental<br />
risk identifi cation has been introduced<br />
globally and builds partly on internal<br />
self-assessment work conducted under<br />
Environmental Blue Grading and Soil Pollution<br />
Dashboards, and partly on an assessment<br />
carried out by <strong>Trelleborg</strong>’s<br />
Environmental management<br />
Number of units<br />
150<br />
120<br />
90<br />
60<br />
30<br />
0<br />
0<br />
2007 2008 2009 2010 <strong>2011</strong><br />
�������� ������������<br />
�������������������������������<br />
�������������<br />
100<br />
The proportion of certifi ed units is the same as in<br />
2010.<br />
<strong>Annual</strong> Report <strong>2011</strong> <strong>Trelleborg</strong> AB<br />
80<br />
60<br />
40<br />
20<br />
property insurance provider, FM Global.<br />
This work and process are based on the<br />
environmental handbook and provide<br />
support for the identifi cation and elimination<br />
of environmental risks linked to<br />
the company’s operations.<br />
Work with target indicators in set key<br />
areas was further developed to better<br />
enable the Group’s monitoring of implementation<br />
and compliance, and half-yearly<br />
data is now also included in these key<br />
areas.<br />
Environmental management<br />
• Proportion of facilities with ISO 14001<br />
certifi cation: 80 (80) percent<br />
An important cornerstone of <strong>Trelleborg</strong>’s<br />
environmental work is the environmental<br />
management standard ISO 14001, a<br />
mandatory requirement for all production<br />
plants in the Group. According to the<br />
Group policy, all larger facilities must<br />
have certifi ed systems. At year-end<br />
<strong>2011</strong>, a total of 91 (90) facilities were<br />
certifi ed, corresponding to about 80 (80)<br />
percent of all facilities.<br />
Energy<br />
• Total energy consumption: 1,232<br />
(1,198) GWh<br />
• Direct energy consumption: 500<br />
(505) GWh<br />
• Total energy consumption/sales: 0.0423<br />
(0.0440) GWh/SEK M<br />
From <strong>2011</strong>, the energy consumption of<br />
non-production units is also included.<br />
This represented about 2 percent of the<br />
total energy consumption.<br />
Energy savings is a focus area for<br />
<strong>Trelleborg</strong>. Since 2009, <strong>Trelleborg</strong>’s Energy<br />
Excellence Program for systematic energyeffi<br />
ciency enhancements (part of Manufacturing<br />
Excellence) has been implemented<br />
at all production units. Energy<br />
excellence is based on self-assessment<br />
and the identifi cation/implementation of<br />
improvement projects through specially<br />
Energy<br />
GWh GWh/SEK M<br />
1,600<br />
1,400<br />
1,200<br />
1,000<br />
800<br />
600<br />
400<br />
200<br />
0<br />
0.00<br />
2007 2008 2009 2010 <strong>2011</strong><br />
GWh<br />
GWh/Net sales, SEK M<br />
0.08<br />
0.07<br />
0.06<br />
0.05<br />
0.04<br />
0.03<br />
0.02<br />
0.01<br />
The Energy Excellence savings program caused a<br />
reduction in energy consumption in relative terms<br />
compared with 2008. This value includes consumption<br />
of electricity, purchased steam and district heating.<br />
trained coordinators at each production<br />
unit – these have formed an improvement<br />
team to introduce cost-saving measures<br />
in reference to buildings, compressed<br />
air, heating/ventilation, lighting and<br />
cooling systems. The project generated<br />
obvious savings in the form of lower energy<br />
consumption and energy costs, and<br />
reduced the Group’s total carbon dioxide<br />
emissions.<br />
The Group’s total energy costs for<br />
<strong>2011</strong> amounted to SEK 634 (658) M.<br />
Climate impact<br />
• Total CO2 emissions: 385,000<br />
(347,000) tons<br />
• Direct CO2 emissions: 110,000<br />
(110,000) tons<br />
• Total CO2 emissions/sales: 13.2<br />
(12.8) tons/SEK M<br />
A signifi cant part of the Group’s climate<br />
footprint is caused by direct carbon dioxide<br />
emissions from the combustion of<br />
fossil fuels and indirectly through the<br />
consumption of purchased electricity,<br />
steam and district heating. The “15 by<br />
15” climate target adopted by Trelle borg<br />
in 2009 (see page 52) addresses these<br />
direct and indirect emissions. While the<br />
trend in emissions arising from direct<br />
energy is progressing in the right direction<br />
in <strong>2011</strong>, the general trend is pointing<br />
in the wrong direction. A contributing<br />
factor is the new addition of the plant in<br />
Xingtai in China, which – via indirect energy<br />
– accounted for a signifi cant increase<br />
in total emissions.<br />
The Group’s <strong>report</strong>ing of indirect emissions<br />
has been adapted to comply with<br />
the Carbon Disclosure Project’s recommendations,<br />
which means that national<br />
conversion factors taken from the Greenhouse<br />
Gas Protocol were applied. <strong>Trelleborg</strong><br />
has taken clear steps to prevent and<br />
reduce the climate-related effects of its<br />
operations, which include effi ciency enhancements<br />
in the areas specifi ed above.<br />
Since 2007, <strong>Trelleborg</strong> has participated<br />
Climate impact<br />
CO2 500,000<br />
400,000<br />
300,000<br />
200,000<br />
100,000<br />
0<br />
0<br />
2007 2008 2009 2010 <strong>2011</strong><br />
CO2 (t) Direct CO2 (t) Indirect<br />
CO2 (t)/Net sales, SEK M<br />
t/SEK M<br />
In <strong>2011</strong>, total carbon dioxide emissions increased<br />
in absolute terms and relative to sales.<br />
20<br />
16<br />
12<br />
GRI: EN3, EN4, EN16, (EN18), (EC2)<br />
8<br />
4