Annual report 2011 - Trelleborg
Annual report 2011 - Trelleborg
Annual report 2011 - Trelleborg

You also want an ePaper? Increase the reach of your titles
YUMPU automatically turns print PDFs into web optimized ePapers that Google loves.
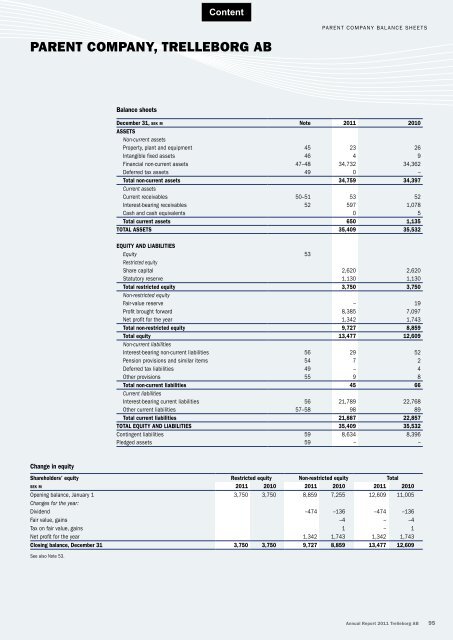
PARENT COMPANY, TRELLEBORG AB<br />
Change in equity<br />
Balance sheets<br />
December 31, sek m Note <strong>2011</strong> 2010<br />
ASSETS<br />
Non-current assets<br />
Property, plant and equipment 45 23 26<br />
Intangible fixed assets 46 4 9<br />
Financial non-current assets 47–48 34,732 34,362<br />
Deferred tax assets 49 0 –<br />
Total non-current assets 34,759 34,397<br />
Current assets<br />
Current receivables 50–51 53 52<br />
Interest-bearing receivables 52 597 1,078<br />
Cash and cash equivalents 0 5<br />
Total current assets 650 1,135<br />
TOTAL ASSETS 35,409 35,532<br />
EQUITY AND LIABILITIES<br />
Equity 53<br />
Restricted equity<br />
Share capital 2,620 2,620<br />
Statutory reserve 1,130 1,130<br />
Total restricted equity 3,750 3,750<br />
Non-restricted equity<br />
Fair-value reserve – 19<br />
Profit brought forward 8,385 7,097<br />
Net profit for the year 1,342 1,743<br />
Total non-restricted equity 9,727 8,859<br />
Total equity 13,477 12,609<br />
Non-current liabilities<br />
Interest-bearing non-current liabilities 56 29 52<br />
Pension provisions and similar items 54 7 2<br />
Deferred tax liabilities 49 – 4<br />
Other provisions 55 9 8<br />
Total non-current liabilities 45 66<br />
Current liabilities<br />
Interest-bearing current liabilities 56 21,789 22,768<br />
Other current liabilities 57–58 98 89<br />
Total current liabilities 21,887 22,857<br />
TOTAL EQUITY AND LIABILITIES 35,409 35,532<br />
Contingent liabilities 59 8,634 8,396<br />
Pledged assets 59 – –<br />
Shareholders’ equity Restricted equity Non-restricted equity Total<br />
sek m <strong>2011</strong> 2010 <strong>2011</strong> 2010 <strong>2011</strong> 2010<br />
Opening balance, January 1 3,750 3,750 8,859 7,255 12,609 11,005<br />
Changes for the year:<br />
Dividend –474 –136 –474 –136<br />
Fair value, gains –4 – –4<br />
Tax on fair value, gains 1 – 1<br />
Net profit for the year 1,342 1,743 1,342 1,743<br />
Closing balance, December 31 3,750 3,750 9,727 8,859 13,477 12,609<br />
See also Note 53.<br />
PARENT COMPANY BALANCE SHEETS<br />
<strong>Annual</strong> Report <strong>2011</strong> <strong>Trelleborg</strong> AB 95