Metering Devices, Protective Relays, Software and ... - Mercado-ideal
Metering Devices, Protective Relays, Software and ... - Mercado-ideal
Metering Devices, Protective Relays, Software and ... - Mercado-ideal
- No tags were found...

You also want an ePaper? Increase the reach of your titles
YUMPU automatically turns print PDFs into web optimized ePapers that Google loves.
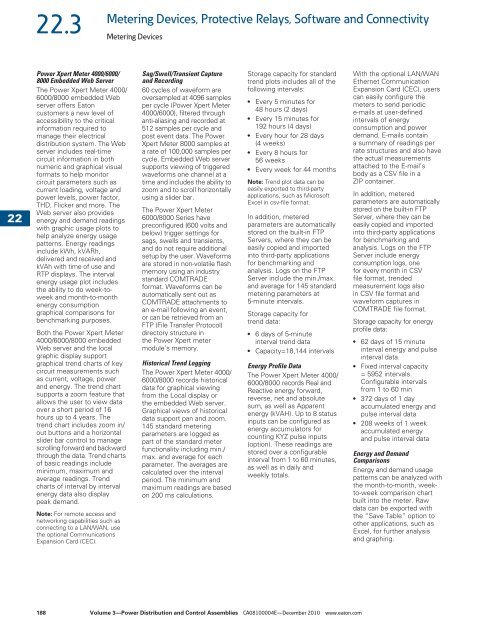
22.3<strong>Metering</strong> <strong>Devices</strong>, <strong>Protective</strong> <strong>Relays</strong>, <strong>Software</strong> <strong>and</strong> Connectivity<strong>Metering</strong> <strong>Devices</strong>222222222222222222222222222222222222222222222222222222222222Power Xpert Meter 4000/6000/8000 Embedded Web ServerThe Power Xpert Meter 4000/6000/8000 embedded Webserver offers Eatoncustomers a new level ofaccessibility to the criticalinformation required tomanage their electricaldistribution system. The Webserver includes real-timecircuit information in bothnumeric <strong>and</strong> graphical visualformats to help monitorcircuit parameters such ascurrent loading, voltage <strong>and</strong>power levels, power factor,THD, Flicker <strong>and</strong> more. TheWeb server also providesenergy <strong>and</strong> dem<strong>and</strong> readingswith graphic usage plots tohelp analyze energy usagepatterns. Energy readingsinclude kWh, kVARh,delivered <strong>and</strong> received <strong>and</strong>kVAh with time of use <strong>and</strong>RTP displays. The intervalenergy usage plot includesthe ability to do week-toweek<strong>and</strong> month-to-monthenergy consumptiongraphical comparisons forbenchmarking purposes.Both the Power Xpert Meter4000/6000/8000 embeddedWeb server <strong>and</strong> the localgraphic display supportgraphical trend charts of keycircuit measurements suchas current, voltage, power<strong>and</strong> energy. The trend chartsupports a zoom feature thatallows the user to view dataover a short period of 16hours up to 4 years. Thetrend chart includes zoom in/out buttons <strong>and</strong> a horizontalslider bar control to managescrolling forward <strong>and</strong> backwardthrough the data. Trend chartsof basic readings includeminimum, maximum <strong>and</strong>average readings. Trendcharts of interval by intervalenergy data also displaypeak dem<strong>and</strong>.Note: For remote access <strong>and</strong>networking capabilities such asconnecting to a LAN/WAN, usethe optional CommunicationsExpansion Card (CEC).Sag/Swell/Transient Capture<strong>and</strong> Recording60 cycles of waveform areoversampled at 4096 samplesper cycle (Power Xpert Meter4000/6000), filtered throughanti-aliasing <strong>and</strong> recorded at512 samples per cycle <strong>and</strong>post event data. The PowerXpert Meter 8000 samples ata rate of 100,000 samples percycle. Embedded Web serversupports viewing of triggeredwaveforms one channel at atime <strong>and</strong> includes the ability tozoom <strong>and</strong> to scroll horizontallyusing a slider bar.The Power Xpert Meter6000/8000 Series havepreconfigured (600 volts <strong>and</strong>below) trigger settings forsags, swells <strong>and</strong> transients,<strong>and</strong> do not require additionalsetup by the user. Waveformsare stored in non-volatile flashmemory using an industryst<strong>and</strong>ard COMTRADEformat. Waveforms can beautomatically sent out asCOMTRADE attachments toan e-mail following an event,or can be retrieved from anFTP (File Transfer Protocol)directory structure inthe Power Xpert metermodule’s memory.Historical Trend LoggingThe Power Xpert Meter 4000/6000/8000 records historicaldata for graphical viewingfrom the Local display orthe embedded Web server.Graphical views of historicaldata support pan <strong>and</strong> zoom.145 st<strong>and</strong>ard meteringparameters are logged aspart of the st<strong>and</strong>ard meterfunctionality including min./max. <strong>and</strong> average for eachparameter. The averages arecalculated over the intervalperiod. The minimum <strong>and</strong>maximum readings are basedon 200 ms calculations.Storage capacity for st<strong>and</strong>ardtrend plots includes all of thefollowing intervals:●●●●●Every 5 minutes for48 hours (2 days)Every 15 minutes for192 hours (4 days)Every hour for 28 days(4 weeks)Every 8 hours for56 weeksEvery week for 44 monthsNote: Trend plot data can beeasily exported to third-partyapplications, such as MicrosoftExcel in csv-file format.In addition, meteredparameters are automaticallystored on the built-in FTPServers, where they can beeasily copied <strong>and</strong> importedinto third-party applicationsfor benchmarking <strong>and</strong>analysis. Logs on the FTPServer include the min./max.<strong>and</strong> average for 145 st<strong>and</strong>ardmetering parameters at5-minute intervals.Storage capacity fortrend data:●●6 days of 5-minuteinterval trend dataCapacity=18,144 intervalsEnergy Profile DataThe Power Xpert Meter 4000/6000/8000 records Real <strong>and</strong>Reactive energy forward,reverse, net <strong>and</strong> absolutesum, as well as Apparentenergy (kVAH). Up to 8 statusinputs can be configured asenergy accumulators forcounting KYZ pulse inputs(option). These readings arestored over a configurableinterval from 1 to 60 minutes,as well as in daily <strong>and</strong>weekly totals.With the optional LAN/WANEthernet CommunicationExpansion Card (CEC), userscan easily configure themeters to send periodice-mails at user-definedintervals of energyconsumption <strong>and</strong> powerdem<strong>and</strong>. E-mails containa summary of readings perrate structures <strong>and</strong> also havethe actual measurementsattached to the E-mail’sbody as a CSV file in aZIP container.In addition, meteredparameters are automaticallystored on the built-in FTPServer, where they can beeasily copied <strong>and</strong> importedinto third-party applicationsfor benchmarking <strong>and</strong>analysis. Logs on the FTPServer include energyconsumption logs, onefor every month in CSVfile format, trendedmeasurement logs alsoin CSV file format <strong>and</strong>waveform captures inCOMTRADE file format.Storage capacity for energyprofile data:●●●●62 days of 15 minuteinterval energy <strong>and</strong> pulseinterval data.Fixed interval capacity= 5952 intervals.Configurable intervalsfrom 1 to 60 min372 days of 1 dayaccumulated energy <strong>and</strong>pulse interval data208 weeks of 1 weekaccumulated energy<strong>and</strong> pulse interval dataEnergy <strong>and</strong> Dem<strong>and</strong>ComparisonsEnergy <strong>and</strong> dem<strong>and</strong> usagepatterns can be analyzed withthe month-to-month, weekto-weekcomparison chartbuilt into the meter. Rawdata can be exported withthe “Save Table” option toother applications, such asExcel, for further analysis<strong>and</strong> graphing.188 Volume 3—Power Distribution <strong>and</strong> Control Assemblies CA08100004E—December 2010 www.eaton.com