2012 Full-year results: Presentation - Unibail-Rodamco
2012 Full-year results: Presentation - Unibail-Rodamco
2012 Full-year results: Presentation - Unibail-Rodamco
Create successful ePaper yourself
Turn your PDF publications into a flip-book with our unique Google optimized e-Paper software.
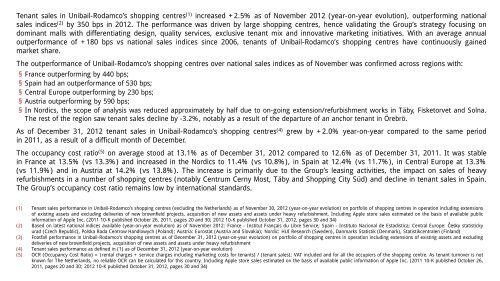
•Tenant sales in <strong>Unibail</strong>-<strong>Rodamco</strong>’s shopping centres (1) increased +2.5% as of November <strong>2012</strong> (<strong>year</strong>-on-<strong>year</strong> evolution), outperforming nationalsales indices (2) by 350 bps in <strong>2012</strong>. The performance was driven by large shopping centres, hence validating the Group’s strategy focusing ondominant malls with differentiating design, quality services, exclusive tenant mix and innovative marketing initiatives. With an average annualoutperformance of +180 bps vs national sales indices since 2006, tenants of <strong>Unibail</strong>-<strong>Rodamco</strong>’s shopping centres have continuously gainedmarket share.•The outperformance of <strong>Unibail</strong>-<strong>Rodamco</strong>’s shopping centres over national sales indices as of November was confirmed across regions with:• France outperforming by 440 bps;• Spain had an outperformance of 530 bps;• Central Europe outperforming by 230 bps;• Austria outperforming by 590 bps;• In Nordics, the scope of analysis was reduced approximately by half due to on-going extension/refurbishment works in Täby, Fisketorvet and Solna.The rest of the region saw tenant sales decline by -3.2%, notably as a result of the departure of an anchor tenant in Örebrö.•As of December 31, <strong>2012</strong> tenant sales in <strong>Unibail</strong>-<strong>Rodamco</strong>’s shopping centres (4) grew by +2.0% <strong>year</strong>-on-<strong>year</strong> compared to the same periodin 2011, as a result of a difficult month of December.•The occupancy cost ratio (5) on average stood at 13.1% as of December 31, <strong>2012</strong> compared to 12.6% as of December 31, 2011. It was stablein France at 13.5% (vs 13.3%) and increased in the Nordics to 11.4% (vs 10.8%), in Spain at 12.4% (vs 11.7%), in Central Europe at 13.3%(vs 11.9%) and in Austria at 14.2% (vs 13.8%). The increase is primarily due to the Group’s leasing activities, the impact on sales of heavyrefurbishments in a number of shopping centres (notably Centrum Cerny Most, Täby and Shopping City Süd) and decline in tenant sales in Spain.The Group’s occupancy cost ratio remains low by international standards.(1) Tenant sales performance in <strong>Unibail</strong>-<strong>Rodamco</strong>’s shopping centres (excluding the Netherlands) as of November 30, <strong>2012</strong> (<strong>year</strong>-on-<strong>year</strong> evolution) on portfolio of shopping centres in operation including extensionsof existing assets and excluding deliveries of new brownfield projects, acquisition of new assets and assets under heavy refurbishment. Including Apple store sales estimated on the basis of available publicinformation of Apple Inc. (2011 10-K published October 26, 2011, pages 20 and 30; <strong>2012</strong> 10-K published October 31, <strong>2012</strong>, pages 30 and 34)(2) Based on latest national indices available (<strong>year</strong>-on-<strong>year</strong> evolution) as of November <strong>2012</strong>: France - Institut Français du Libre Service; Spain - Instituto Nacional de Estadistica; Central Europe: Česky statistickyurad (Czech Republic), Polska Rada Centrow Handlowych (Poland); Austria: Eurostat (Austria and Slovakia); Nordic: HUI Research (Sweden), Danmarks Statistik (Denmark), Statistikcentralen (Finland)(3) Footfall performance in <strong>Unibail</strong>-<strong>Rodamco</strong>’s shopping centres as of December 31, <strong>2012</strong> (<strong>year</strong>-on-<strong>year</strong> evolution) on portfolio of shopping centres in operation including extensions of existing assets and excludingdeliveries of new brownfield projects, acquisition of new assets and assets under heavy refurbishment(4) Tenant sales performance as defined in (1) as of December 31, <strong>2012</strong> (<strong>year</strong>-on-<strong>year</strong> evolution)(5) OCR (Occupancy Cost Ratio) = (rental charges + service charges including marketing costs for tenants) / (tenant sales); VAT included and for all the occupiers of the shopping centre. As tenant turnover is notknown for The Netherlands, no reliable OCR can be calculated for this country. Including Apple store sales estimated on the basis of available public information of Apple Inc. (2011 10-K published October 26,2011, pages 20 and 30; <strong>2012</strong> 10-K published October 31, <strong>2012</strong>, pages 30 and 34)


