Comparison of 9.5 mm SuperPave and Marshall Wearing I Mixes in ...
Comparison of 9.5 mm SuperPave and Marshall Wearing I Mixes in ...
Comparison of 9.5 mm SuperPave and Marshall Wearing I Mixes in ...

You also want an ePaper? Increase the reach of your titles
YUMPU automatically turns print PDFs into web optimized ePapers that Google loves.
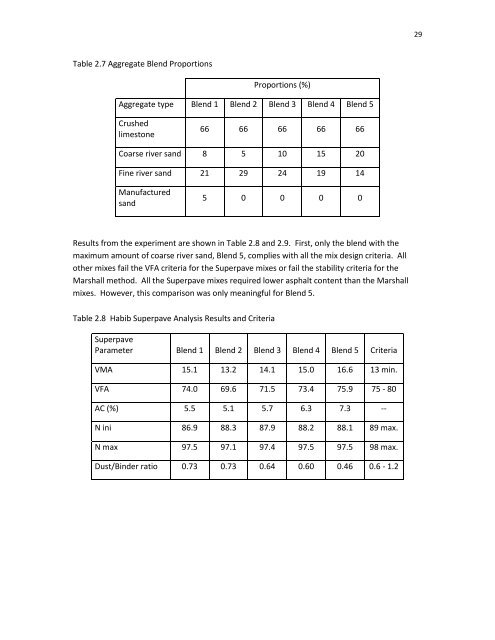
29Table 2.7 Aggregate Blend ProportionsProportions (%)Aggregate type Blend 1 Blend 2 Blend 3 Blend 4 Blend 5Crushedlimestone66 66 66 66 66Coarse river s<strong>and</strong> 8 5 10 15 20F<strong>in</strong>e river s<strong>and</strong> 21 29 24 19 14Manufactureds<strong>and</strong>5 0 0 0 0Results from the experiment are shown <strong>in</strong> Table 2.8 <strong>and</strong> 2.9. First, only the blend with themaximum amount <strong>of</strong> coarse river s<strong>and</strong>, Blend 5, complies with all the mix design criteria. Allother mixes fail the VFA criteria for the Superpave mixes or fail the stability criteria for the<strong>Marshall</strong> method. All the Superpave mixes required lower asphalt content than the <strong>Marshall</strong>mixes. However, this comparison was only mean<strong>in</strong>gful for Blend 5.Table 2.8 Habib Superpave Analysis Results <strong>and</strong> CriteriaSuperpaveParameter Blend 1 Blend 2 Blend 3 Blend 4 Blend 5 CriteriaVMA 15.1 13.2 14.1 15.0 16.6 13 m<strong>in</strong>.VFA 74.0 69.6 71.5 73.4 75.9 75 - 80AC (%) 5.5 5.1 5.7 6.3 7.3 --N <strong>in</strong>i 86.9 88.3 87.9 88.2 88.1 89 max.N max 97.5 97.1 97.4 97.5 97.5 98 max.Dust/B<strong>in</strong>der ratio 0.73 0.73 0.64 0.60 0.46 0.6 - 1.2