Comparison of 9.5 mm SuperPave and Marshall Wearing I Mixes in ...
Comparison of 9.5 mm SuperPave and Marshall Wearing I Mixes in ...
Comparison of 9.5 mm SuperPave and Marshall Wearing I Mixes in ...

Create successful ePaper yourself
Turn your PDF publications into a flip-book with our unique Google optimized e-Paper software.
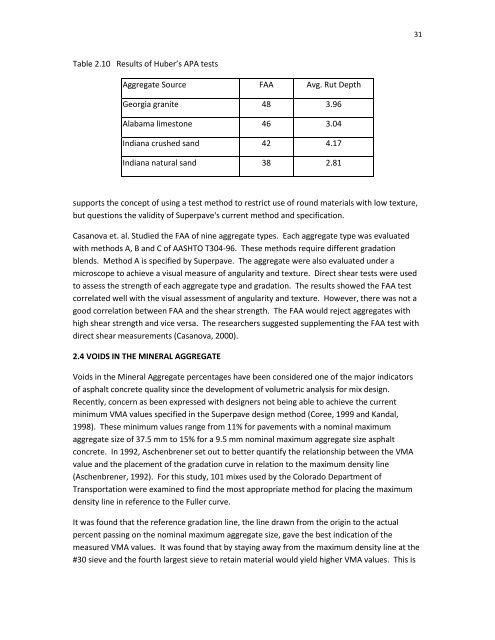
31Table 2.10 Results <strong>of</strong> Huber’s APA testsAggregate Source FAA Avg. Rut DepthGeorgia granite 48 3.96Alabama limestone 46 3.04Indiana crushed s<strong>and</strong> 42 4.17Indiana natural s<strong>and</strong> 38 2.81supports the concept <strong>of</strong> us<strong>in</strong>g a test method to restrict use <strong>of</strong> round materials with low texture,but questions the validity <strong>of</strong> Superpave's current method <strong>and</strong> specification.Casanova et. al. Studied the FAA <strong>of</strong> n<strong>in</strong>e aggregate types. Each aggregate type was evaluatedwith methods A, B <strong>and</strong> C <strong>of</strong> AASHTO T304-96. These methods require different gradationblends. Method A is specified by Superpave. The aggregate were also evaluated under amicroscope to achieve a visual measure <strong>of</strong> angularity <strong>and</strong> texture. Direct shear tests were usedto assess the strength <strong>of</strong> each aggregate type <strong>and</strong> gradation. The results showed the FAA testcorrelated well with the visual assessment <strong>of</strong> angularity <strong>and</strong> texture. However, there was not agood correlation between FAA <strong>and</strong> the shear strength. The FAA would reject aggregates withhigh shear strength <strong>and</strong> vice versa. The researchers suggested supplement<strong>in</strong>g the FAA test withdirect shear measurements (Casanova, 2000).2.4 VOIDS IN THE MINERAL AGGREGATEVoids <strong>in</strong> the M<strong>in</strong>eral Aggregate percentages have been considered one <strong>of</strong> the major <strong>in</strong>dicators<strong>of</strong> asphalt concrete quality s<strong>in</strong>ce the development <strong>of</strong> volumetric analysis for mix design.Recently, concern as been expressed with designers not be<strong>in</strong>g able to achieve the currentm<strong>in</strong>imum VMA values specified <strong>in</strong> the Superpave design method (Coree, 1999 <strong>and</strong> K<strong>and</strong>al,1998). These m<strong>in</strong>imum values range from 11% for pavements with a nom<strong>in</strong>al maximumaggregate size <strong>of</strong> 37.5 <strong>mm</strong> to 15% for a <strong>9.5</strong> <strong>mm</strong> nom<strong>in</strong>al maximum aggregate size asphaltconcrete. In 1992, Aschenbrener set out to better quantify the relationship between the VMAvalue <strong>and</strong> the placement <strong>of</strong> the gradation curve <strong>in</strong> relation to the maximum density l<strong>in</strong>e(Aschenbrener, 1992). For this study, 101 mixes used by the Colorado Department <strong>of</strong>Transportation were exam<strong>in</strong>ed to f<strong>in</strong>d the most appropriate method for plac<strong>in</strong>g the maximumdensity l<strong>in</strong>e <strong>in</strong> reference to the Fuller curve.It was found that the reference gradation l<strong>in</strong>e, the l<strong>in</strong>e drawn from the orig<strong>in</strong> to the actualpercent pass<strong>in</strong>g on the nom<strong>in</strong>al maximum aggregate size, gave the best <strong>in</strong>dication <strong>of</strong> themeasured VMA values. It was found that by stay<strong>in</strong>g away from the maximum density l<strong>in</strong>e at the#30 sieve <strong>and</strong> the fourth largest sieve to reta<strong>in</strong> material would yield higher VMA values. This is