Comparison of 9.5 mm SuperPave and Marshall Wearing I Mixes in ...
Comparison of 9.5 mm SuperPave and Marshall Wearing I Mixes in ...
Comparison of 9.5 mm SuperPave and Marshall Wearing I Mixes in ...

You also want an ePaper? Increase the reach of your titles
YUMPU automatically turns print PDFs into web optimized ePapers that Google loves.
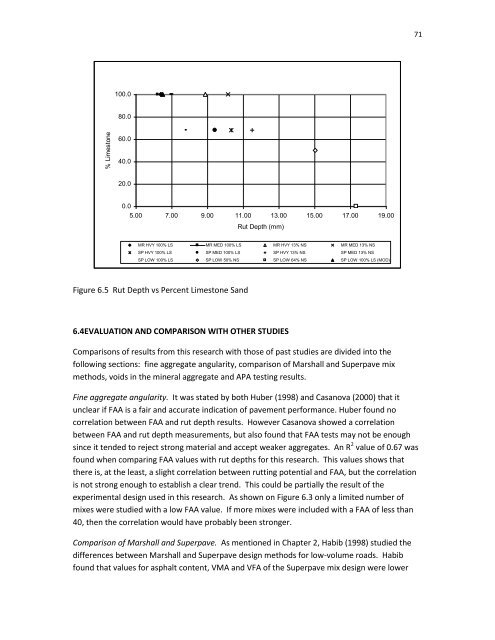
% Limestone71100.080.060.040.020.00.05.00 7.00 9.00 11.00 13.00 15.00 17.00 19.00Rut Depth (<strong>mm</strong>)MR HVY 100% LS MR MED 100% LS MR HVY 13% NS MR MED 13% NSSP HVY 100% LS SP MED 100% LS SP HVY 13% NS SP MED 13% NSSP LOW 100% LS SP LOW 50% NS SP LOW 64% NS SP LOW 100% LS (MOD)Figure 6.5 Rut Depth vs Percent Limestone S<strong>and</strong>6.4EVALUATION AND COMPARISON WITH OTHER STUDIES<strong>Comparison</strong>s <strong>of</strong> results from this research with those <strong>of</strong> past studies are divided <strong>in</strong>to thefollow<strong>in</strong>g sections: f<strong>in</strong>e aggregate angularity, comparison <strong>of</strong> <strong>Marshall</strong> <strong>and</strong> Superpave mixmethods, voids <strong>in</strong> the m<strong>in</strong>eral aggregate <strong>and</strong> APA test<strong>in</strong>g results.F<strong>in</strong>e aggregate angularity. It was stated by both Huber (1998) <strong>and</strong> Casanova (2000) that itunclear if FAA is a fair <strong>and</strong> accurate <strong>in</strong>dication <strong>of</strong> pavement performance. Huber found nocorrelation between FAA <strong>and</strong> rut depth results. However Casanova showed a correlationbetween FAA <strong>and</strong> rut depth measurements, but also found that FAA tests may not be enoughs<strong>in</strong>ce it tended to reject strong material <strong>and</strong> accept weaker aggregates. An R 2 value <strong>of</strong> 0.67 wasfound when compar<strong>in</strong>g FAA values with rut depths for this research. This values shows thatthere is, at the least, a slight correlation between rutt<strong>in</strong>g potential <strong>and</strong> FAA, but the correlationis not strong enough to establish a clear trend. This could be partially the result <strong>of</strong> theexperimental design used <strong>in</strong> this research. As shown on Figure 6.3 only a limited number <strong>of</strong>mixes were studied with a low FAA value. If more mixes were <strong>in</strong>cluded with a FAA <strong>of</strong> less than40, then the correlation would have probably been stronger.<strong>Comparison</strong> <strong>of</strong> <strong>Marshall</strong> <strong>and</strong> Superpave. As mentioned <strong>in</strong> Chapter 2, Habib (1998) studied thedifferences between <strong>Marshall</strong> <strong>and</strong> Superpave design methods for low-volume roads. Habibfound that values for asphalt content, VMA <strong>and</strong> VFA <strong>of</strong> the Superpave mix design were lower