Comparison of 9.5 mm SuperPave and Marshall Wearing I Mixes in ...
Comparison of 9.5 mm SuperPave and Marshall Wearing I Mixes in ...
Comparison of 9.5 mm SuperPave and Marshall Wearing I Mixes in ...

You also want an ePaper? Increase the reach of your titles
YUMPU automatically turns print PDFs into web optimized ePapers that Google loves.
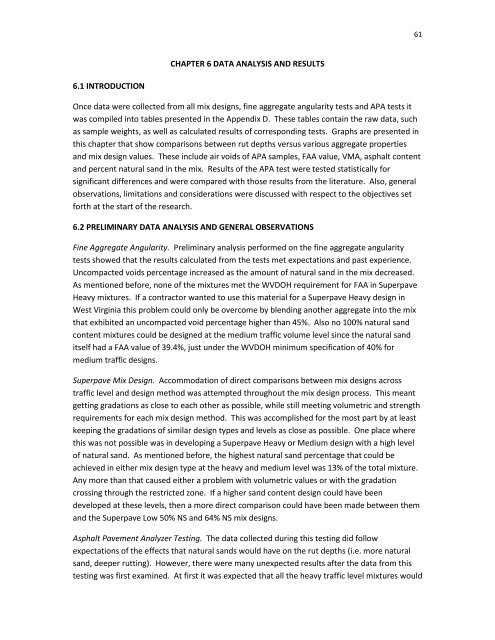
61CHAPTER 6 DATA ANALYSIS AND RESULTS6.1 INTRODUCTIONOnce data were collected from all mix designs, f<strong>in</strong>e aggregate angularity tests <strong>and</strong> APA tests itwas compiled <strong>in</strong>to tables presented <strong>in</strong> the Appendix D. These tables conta<strong>in</strong> the raw data, suchas sample weights, as well as calculated results <strong>of</strong> correspond<strong>in</strong>g tests. Graphs are presented <strong>in</strong>this chapter that show comparisons between rut depths versus various aggregate properties<strong>and</strong> mix design values. These <strong>in</strong>clude air voids <strong>of</strong> APA samples, FAA value, VMA, asphalt content<strong>and</strong> percent natural s<strong>and</strong> <strong>in</strong> the mix. Results <strong>of</strong> the APA test were tested statistically forsignificant differences <strong>and</strong> were compared with those results from the literature. Also, generalobservations, limitations <strong>and</strong> considerations were discussed with respect to the objectives setforth at the start <strong>of</strong> the research.6.2 PRELIMINARY DATA ANALYSIS AND GENERAL OBSERVATIONSF<strong>in</strong>e Aggregate Angularity. Prelim<strong>in</strong>ary analysis performed on the f<strong>in</strong>e aggregate angularitytests showed that the results calculated from the tests met expectations <strong>and</strong> past experience.Uncompacted voids percentage <strong>in</strong>creased as the amount <strong>of</strong> natural s<strong>and</strong> <strong>in</strong> the mix decreased.As mentioned before, none <strong>of</strong> the mixtures met the WVDOH requirement for FAA <strong>in</strong> SuperpaveHeavy mixtures. If a contractor wanted to use this material for a Superpave Heavy design <strong>in</strong>West Virg<strong>in</strong>ia this problem could only be overcome by blend<strong>in</strong>g another aggregate <strong>in</strong>to the mixthat exhibited an uncompacted void percentage higher than 45%. Also no 100% natural s<strong>and</strong>content mixtures could be designed at the medium traffic volume level s<strong>in</strong>ce the natural s<strong>and</strong>itself had a FAA value <strong>of</strong> 39.4%, just under the WVDOH m<strong>in</strong>imum specification <strong>of</strong> 40% formedium traffic designs.Superpave Mix Design. Acco<strong>mm</strong>odation <strong>of</strong> direct comparisons between mix designs acrosstraffic level <strong>and</strong> design method was attempted throughout the mix design process. This meantgett<strong>in</strong>g gradations as close to each other as possible, while still meet<strong>in</strong>g volumetric <strong>and</strong> strengthrequirements for each mix design method. This was accomplished for the most part by at leastkeep<strong>in</strong>g the gradations <strong>of</strong> similar design types <strong>and</strong> levels as close as possible. One place wherethis was not possible was <strong>in</strong> develop<strong>in</strong>g a Superpave Heavy or Medium design with a high level<strong>of</strong> natural s<strong>and</strong>. As mentioned before, the highest natural s<strong>and</strong> percentage that could beachieved <strong>in</strong> either mix design type at the heavy <strong>and</strong> medium level was 13% <strong>of</strong> the total mixture.Any more than that caused either a problem with volumetric values or with the gradationcross<strong>in</strong>g through the restricted zone. If a higher s<strong>and</strong> content design could have beendeveloped at these levels, then a more direct comparison could have been made between them<strong>and</strong> the Superpave Low 50% NS <strong>and</strong> 64% NS mix designs.Asphalt Pavement Analyzer Test<strong>in</strong>g. The data collected dur<strong>in</strong>g this test<strong>in</strong>g did followexpectations <strong>of</strong> the effects that natural s<strong>and</strong>s would have on the rut depths (i.e. more naturals<strong>and</strong>, deeper rutt<strong>in</strong>g). However, there were many unexpected results after the data from thistest<strong>in</strong>g was first exam<strong>in</strong>ed. At first it was expected that all the heavy traffic level mixtures would