Comparison of 9.5 mm SuperPave and Marshall Wearing I Mixes in ...
Comparison of 9.5 mm SuperPave and Marshall Wearing I Mixes in ...
Comparison of 9.5 mm SuperPave and Marshall Wearing I Mixes in ...

You also want an ePaper? Increase the reach of your titles
YUMPU automatically turns print PDFs into web optimized ePapers that Google loves.
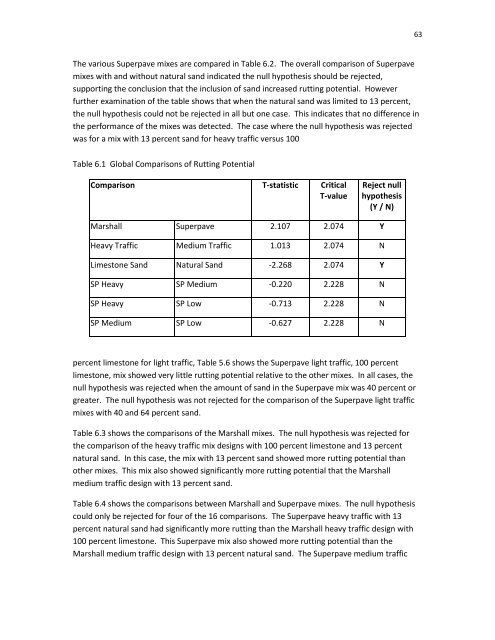
63The various Superpave mixes are compared <strong>in</strong> Table 6.2. The overall comparison <strong>of</strong> Superpavemixes with <strong>and</strong> without natural s<strong>and</strong> <strong>in</strong>dicated the null hypothesis should be rejected,support<strong>in</strong>g the conclusion that the <strong>in</strong>clusion <strong>of</strong> s<strong>and</strong> <strong>in</strong>creased rutt<strong>in</strong>g potential. Howeverfurther exam<strong>in</strong>ation <strong>of</strong> the table shows that when the natural s<strong>and</strong> was limited to 13 percent,the null hypothesis could not be rejected <strong>in</strong> all but one case. This <strong>in</strong>dicates that no difference <strong>in</strong>the performance <strong>of</strong> the mixes was detected. The case where the null hypothesis was rejectedwas for a mix with 13 percent s<strong>and</strong> for heavy traffic versus 100Table 6.1 Global <strong>Comparison</strong>s <strong>of</strong> Rutt<strong>in</strong>g Potential<strong>Comparison</strong> T-statistic CriticalT-valueReject nullhypothesis(Y / N)<strong>Marshall</strong> Superpave 2.107 2.074 YHeavy Traffic Medium Traffic 1.013 2.074 NLimestone S<strong>and</strong> Natural S<strong>and</strong> -2.268 2.074 YSP Heavy SP Medium -0.220 2.228 NSP Heavy SP Low -0.713 2.228 NSP Medium SP Low -0.627 2.228 Npercent limestone for light traffic, Table 5.6 shows the Superpave light traffic, 100 percentlimestone, mix showed very little rutt<strong>in</strong>g potential relative to the other mixes. In all cases, thenull hypothesis was rejected when the amount <strong>of</strong> s<strong>and</strong> <strong>in</strong> the Superpave mix was 40 percent orgreater. The null hypothesis was not rejected for the comparison <strong>of</strong> the Superpave light trafficmixes with 40 <strong>and</strong> 64 percent s<strong>and</strong>.Table 6.3 shows the comparisons <strong>of</strong> the <strong>Marshall</strong> mixes. The null hypothesis was rejected forthe comparison <strong>of</strong> the heavy traffic mix designs with 100 percent limestone <strong>and</strong> 13 percentnatural s<strong>and</strong>. In this case, the mix with 13 percent s<strong>and</strong> showed more rutt<strong>in</strong>g potential thanother mixes. This mix also showed significantly more rutt<strong>in</strong>g potential that the <strong>Marshall</strong>medium traffic design with 13 percent s<strong>and</strong>.Table 6.4 shows the comparisons between <strong>Marshall</strong> <strong>and</strong> Superpave mixes. The null hypothesiscould only be rejected for four <strong>of</strong> the 16 comparisons. The Superpave heavy traffic with 13percent natural s<strong>and</strong> had significantly more rutt<strong>in</strong>g than the <strong>Marshall</strong> heavy traffic design with100 percent limestone. This Superpave mix also showed more rutt<strong>in</strong>g potential than the<strong>Marshall</strong> medium traffic design with 13 percent natural s<strong>and</strong>. The Superpave medium traffic