Comparison of 9.5 mm SuperPave and Marshall Wearing I Mixes in ...
Comparison of 9.5 mm SuperPave and Marshall Wearing I Mixes in ...
Comparison of 9.5 mm SuperPave and Marshall Wearing I Mixes in ...

Create successful ePaper yourself
Turn your PDF publications into a flip-book with our unique Google optimized e-Paper software.
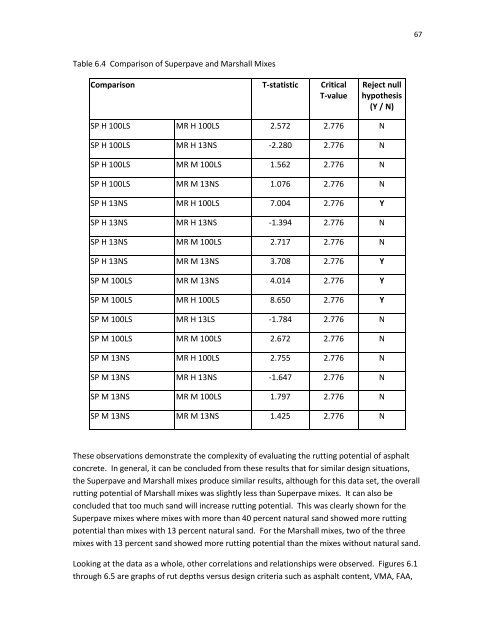
67Table 6.4 <strong>Comparison</strong> <strong>of</strong> Superpave <strong>and</strong> <strong>Marshall</strong> <strong>Mixes</strong><strong>Comparison</strong> T-statistic CriticalT-valueReject nullhypothesis(Y / N)SP H 100LS MR H 100LS 2.572 2.776 NSP H 100LS MR H 13NS -2.280 2.776 NSP H 100LS MR M 100LS 1.562 2.776 NSP H 100LS MR M 13NS 1.076 2.776 NSP H 13NS MR H 100LS 7.004 2.776 YSP H 13NS MR H 13NS -1.394 2.776 NSP H 13NS MR M 100LS 2.717 2.776 NSP H 13NS MR M 13NS 3.708 2.776 YSP M 100LS MR M 13NS 4.014 2.776 YSP M 100LS MR H 100LS 8.650 2.776 YSP M 100LS MR H 13LS -1.784 2.776 NSP M 100LS MR M 100LS 2.672 2.776 NSP M 13NS MR H 100LS 2.755 2.776 NSP M 13NS MR H 13NS -1.647 2.776 NSP M 13NS MR M 100LS 1.797 2.776 NSP M 13NS MR M 13NS 1.425 2.776 NThese observations demonstrate the complexity <strong>of</strong> evaluat<strong>in</strong>g the rutt<strong>in</strong>g potential <strong>of</strong> asphaltconcrete. In general, it can be concluded from these results that for similar design situations,the Superpave <strong>and</strong> <strong>Marshall</strong> mixes produce similar results, although for this data set, the overallrutt<strong>in</strong>g potential <strong>of</strong> <strong>Marshall</strong> mixes was slightly less than Superpave mixes. It can also beconcluded that too much s<strong>and</strong> will <strong>in</strong>crease rutt<strong>in</strong>g potential. This was clearly shown for theSuperpave mixes where mixes with more than 40 percent natural s<strong>and</strong> showed more rutt<strong>in</strong>gpotential than mixes with 13 percent natural s<strong>and</strong>. For the <strong>Marshall</strong> mixes, two <strong>of</strong> the threemixes with 13 percent s<strong>and</strong> showed more rutt<strong>in</strong>g potential than the mixes without natural s<strong>and</strong>.Look<strong>in</strong>g at the data as a whole, other correlations <strong>and</strong> relationships were observed. Figures 6.1through 6.5 are graphs <strong>of</strong> rut depths versus design criteria such as asphalt content, VMA, FAA,