Comparison of 9.5 mm SuperPave and Marshall Wearing I Mixes in ...
Comparison of 9.5 mm SuperPave and Marshall Wearing I Mixes in ...
Comparison of 9.5 mm SuperPave and Marshall Wearing I Mixes in ...

You also want an ePaper? Increase the reach of your titles
YUMPU automatically turns print PDFs into web optimized ePapers that Google loves.
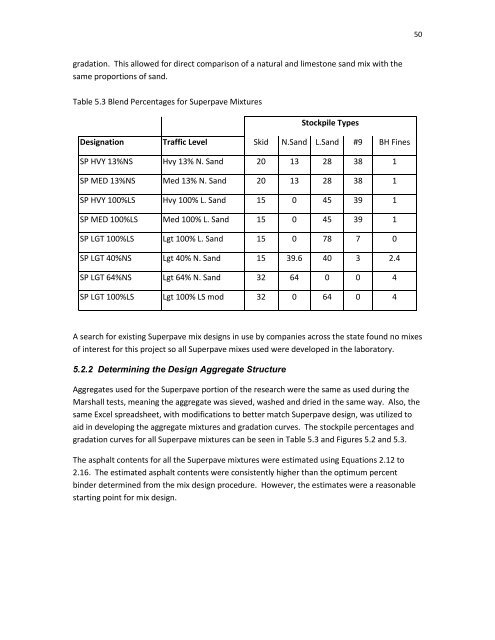
50gradation. This allowed for direct comparison <strong>of</strong> a natural <strong>and</strong> limestone s<strong>and</strong> mix with thesame proportions <strong>of</strong> s<strong>and</strong>.Table 5.3 Blend Percentages for Superpave MixturesStockpile TypesDesignation Traffic Level Skid N.S<strong>and</strong> L.S<strong>and</strong> #9 BH F<strong>in</strong>esSP HVY 13%NS Hvy 13% N. S<strong>and</strong> 20 13 28 38 1SP MED 13%NS Med 13% N. S<strong>and</strong> 20 13 28 38 1SP HVY 100%LS Hvy 100% L. S<strong>and</strong> 15 0 45 39 1SP MED 100%LS Med 100% L. S<strong>and</strong> 15 0 45 39 1SP LGT 100%LS Lgt 100% L. S<strong>and</strong> 15 0 78 7 0SP LGT 40%NS Lgt 40% N. S<strong>and</strong> 15 39.6 40 3 2.4SP LGT 64%NS Lgt 64% N. S<strong>and</strong> 32 64 0 0 4SP LGT 100%LS Lgt 100% LS mod 32 0 64 0 4A search for exist<strong>in</strong>g Superpave mix designs <strong>in</strong> use by companies across the state found no mixes<strong>of</strong> <strong>in</strong>terest for this project so all Superpave mixes used were developed <strong>in</strong> the laboratory.5.2.2 Determ<strong>in</strong><strong>in</strong>g the Design Aggregate StructureAggregates used for the Superpave portion <strong>of</strong> the research were the same as used dur<strong>in</strong>g the<strong>Marshall</strong> tests, mean<strong>in</strong>g the aggregate was sieved, washed <strong>and</strong> dried <strong>in</strong> the same way. Also, thesame Excel spreadsheet, with modifications to better match Superpave design, was utilized toaid <strong>in</strong> develop<strong>in</strong>g the aggregate mixtures <strong>and</strong> gradation curves. The stockpile percentages <strong>and</strong>gradation curves for all Superpave mixtures can be seen <strong>in</strong> Table 5.3 <strong>and</strong> Figures 5.2 <strong>and</strong> 5.3.The asphalt contents for all the Superpave mixtures were estimated us<strong>in</strong>g Equations 2.12 to2.16. The estimated asphalt contents were consistently higher than the optimum percentb<strong>in</strong>der determ<strong>in</strong>ed from the mix design procedure. However, the estimates were a reasonablestart<strong>in</strong>g po<strong>in</strong>t for mix design.