Comparison of 9.5 mm SuperPave and Marshall Wearing I Mixes in ...
Comparison of 9.5 mm SuperPave and Marshall Wearing I Mixes in ...
Comparison of 9.5 mm SuperPave and Marshall Wearing I Mixes in ...

Create successful ePaper yourself
Turn your PDF publications into a flip-book with our unique Google optimized e-Paper software.
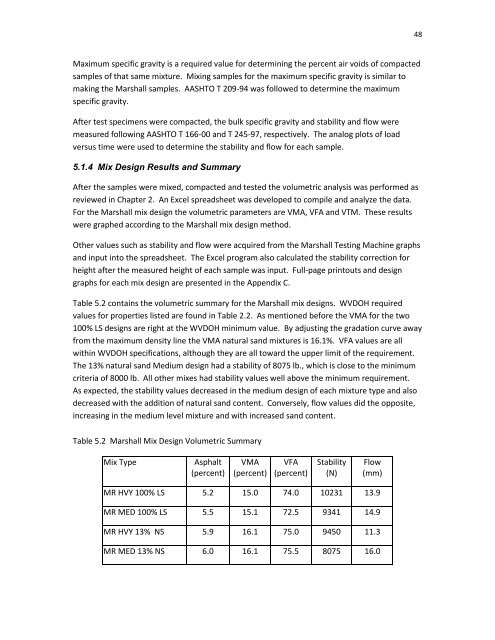
48Maximum specific gravity is a required value for determ<strong>in</strong><strong>in</strong>g the percent air voids <strong>of</strong> compactedsamples <strong>of</strong> that same mixture. Mix<strong>in</strong>g samples for the maximum specific gravity is similar tomak<strong>in</strong>g the <strong>Marshall</strong> samples. AASHTO T 209-94 was followed to determ<strong>in</strong>e the maximumspecific gravity.After test specimens were compacted, the bulk specific gravity <strong>and</strong> stability <strong>and</strong> flow weremeasured follow<strong>in</strong>g AASHTO T 166-00 <strong>and</strong> T 245-97, respectively. The analog plots <strong>of</strong> loadversus time were used to determ<strong>in</strong>e the stability <strong>and</strong> flow for each sample.5.1.4 Mix Design Results <strong>and</strong> Su<strong>mm</strong>aryAfter the samples were mixed, compacted <strong>and</strong> tested the volumetric analysis was performed asreviewed <strong>in</strong> Chapter 2. An Excel spreadsheet was developed to compile <strong>and</strong> analyze the data.For the <strong>Marshall</strong> mix design the volumetric parameters are VMA, VFA <strong>and</strong> VTM. These resultswere graphed accord<strong>in</strong>g to the <strong>Marshall</strong> mix design method.Other values such as stability <strong>and</strong> flow were acquired from the <strong>Marshall</strong> Test<strong>in</strong>g Mach<strong>in</strong>e graphs<strong>and</strong> <strong>in</strong>put <strong>in</strong>to the spreadsheet. The Excel program also calculated the stability correction forheight after the measured height <strong>of</strong> each sample was <strong>in</strong>put. Full-page pr<strong>in</strong>touts <strong>and</strong> designgraphs for each mix design are presented <strong>in</strong> the Appendix C.Table 5.2 conta<strong>in</strong>s the volumetric su<strong>mm</strong>ary for the <strong>Marshall</strong> mix designs. WVDOH requiredvalues for properties listed are found <strong>in</strong> Table 2.2. As mentioned before the VMA for the two100% LS designs are right at the WVDOH m<strong>in</strong>imum value. By adjust<strong>in</strong>g the gradation curve awayfrom the maximum density l<strong>in</strong>e the VMA natural s<strong>and</strong> mixtures is 16.1%. VFA values are allwith<strong>in</strong> WVDOH specifications, although they are all toward the upper limit <strong>of</strong> the requirement.The 13% natural s<strong>and</strong> Medium design had a stability <strong>of</strong> 8075 lb., which is close to the m<strong>in</strong>imumcriteria <strong>of</strong> 8000 lb. All other mixes had stability values well above the m<strong>in</strong>imum requirement.As expected, the stability values decreased <strong>in</strong> the medium design <strong>of</strong> each mixture type <strong>and</strong> alsodecreased with the addition <strong>of</strong> natural s<strong>and</strong> content. Conversely, flow values did the opposite,<strong>in</strong>creas<strong>in</strong>g <strong>in</strong> the medium level mixture <strong>and</strong> with <strong>in</strong>creased s<strong>and</strong> content.Table 5.2 <strong>Marshall</strong> Mix Design Volumetric Su<strong>mm</strong>aryMix TypeAsphalt(percent)VMA(percent)VFA(percent)Stability(N)Flow(<strong>mm</strong>)MR HVY 100% LS 5.2 15.0 74.0 10231 13.9MR MED 100% LS 5.5 15.1 72.5 9341 14.9MR HVY 13% NS 5.9 16.1 75.0 9450 11.3MR MED 13% NS 6.0 16.1 75.5 8075 16.0