- Page 1 and 2:
Literature Review: Pregnant andbrea
- Page 3 and 4:
References ........................
- Page 5 and 6:
Salt / Sodium .....................
- Page 7 and 8:
AbbreviationSRSSBMeaningSystematic
- Page 9 and 10:
Inclusion and exclusion criteriaStu
- Page 11 and 12:
Pregnancy and breastfeeding dietary
- Page 13 and 14:
Evidence SummariesMother1. In a Nor
- Page 15 and 16:
12. In a Cochrane systematic review
- Page 17 and 18:
o ‘western’ diet 3583 [525]o
- Page 19 and 20:
Breastfeeding35. In a nonrandomised
- Page 21:
Other Childhood Outcomes47. In a co
- Page 24 and 25:
Reference Brantsaeter 2009Dietary p
- Page 26 and 27:
Reference Cole 2009Dietary patterns
- Page 28 and 29:
Reference De Batlle 2008Dietary pat
- Page 30 and 31:
ReferenceFood typeStudy typeLevel o
- Page 32 and 33:
Reference Haugen 2008Dietary patter
- Page 34 and 35:
Reference Haugen 2005Dietary patter
- Page 36 and 37:
ReferenceKinnunen 2007aDietary patt
- Page 38 and 39:
Reference Knudsen 2008Dietary patte
- Page 40 and 41:
Reference Koebnick 2001Dietary patt
- Page 42 and 43:
Prudent:OR 0.98 95% CI 0.82 to 1.18
- Page 44 and 45:
Reference Laraia 2007Dietary patter
- Page 46 and 47:
FollowupTo birthConfoundingAdjusted
- Page 48 and 49:
Reference North 2000Dietary pattern
- Page 50 and 51:
Reference Radesky 2008Food typePrud
- Page 52 and 53:
Reference Rifas-Shiman 2009Dietary
- Page 54 and 55:
Reference Robinson 2007Dietary patt
- Page 56 and 57:
Risk of biasRelevanceOther comments
- Page 58 and 59:
Reference Shaheen 2009Dietary patte
- Page 60 and 61:
Traditional 0.02 (-0.01 to 0.05) 0.
- Page 62 and 63:
Risk of biasRelevanceOther comments
- Page 64 and 65:
Reference Thompson 2010Dietary patt
- Page 66 and 67:
Reference Uusitalo 2009Dietary patt
- Page 68 and 69:
Reference Vujkovic 2009Dietary patt
- Page 70 and 71: Confounding 1) Western diet adjuste
- Page 72 and 73: Reference Xiang 2005Dietary pattern
- Page 74 and 75: FollowupConfoundingRisk of biasMate
- Page 76 and 77: Reference Zhang 2006Food typePruden
- Page 78 and 79: Koebnick C, Hoffmann I, Dagnelie PC
- Page 80 and 81: Included StudiesCaffeineStudyOutcom
- Page 82 and 83: 10. In the eleven studies (includin
- Page 84 and 85: Evidence TablesReference Adeney 200
- Page 86 and 87: 2-3.9 caffeine units/day aOR 1.08 (
- Page 88 and 89: Reference Chen 2009Food groupsCaffe
- Page 90 and 91: ReferenceGreenwood 2010 (CARE group
- Page 92 and 93: Reference Knox 1972Food typeCaffein
- Page 94 and 95: Reference Leviton 2002Food typeCaff
- Page 96 and 97: control mothers. No adjustment for
- Page 98 and 99: Perinatal Deaths Tebbutt 1984 (39 w
- Page 100 and 101: studies e.g. 300 mg/day) no associa
- Page 102 and 103: Associations with spina bifida were
- Page 104 and 105: Reference Robinson 2009Food groupCa
- Page 106 and 107: Included StudiesCerealStudyOutcomes
- Page 108 and 109: nonlactating women significantly re
- Page 110 and 111: Evidence TableReference Chatzi 2008
- Page 112 and 113: Reference Godfrey 1996Food typeCere
- Page 114 and 115: Reference Jensen 2004Food typeCerea
- Page 116 and 117: Reference Kwan 2009Food typeCereals
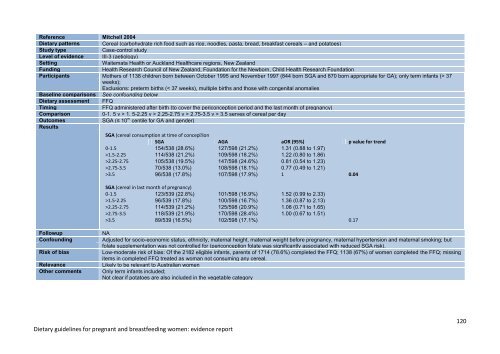
- Page 118 and 119: Reference Laraia 2007Dietary patter
- Page 122 and 123: Reference Petridou 2005Food typeCer
- Page 124 and 125: ReferencePetridou 1998bFood type Ce
- Page 126 and 127: Reference Stuebe 2009Dietary patter
- Page 128 and 129: Reference Willers 2007Food typeCere
- Page 130 and 131: Q3 (4.6 to 5.6) 136/20,229 0.83 (0.
- Page 132 and 133: Stuebe AM, Oken E and Gillman MW. "
- Page 134 and 135: 29. Miyake 2006 Postpartum depressi
- Page 136 and 137: 12. In a UK case-control study, the
- Page 138 and 139: 25. In a US RCT, adolescent women r
- Page 140 and 141: childhood brain tumours (medullobla
- Page 142 and 143: Reference Campbell-Brown 1983Food t
- Page 144 and 145: Reference Chang 2003Food typeDairy
- Page 146 and 147: Reference Chatzi 2008Food typeDairy
- Page 148: Reference Elwood 1981Food typeDairy
- Page 151 and 152: Reference George 2005Food typeDairy
- Page 153 and 154: Reference Giordano 2008Food typeDai
- Page 155 and 156: Reference Haggarty 2009Dietary patt
- Page 157 and 158: Reference Jakobbson 1983Dietary pat
- Page 159 and 160: Reference Javaid 2005Food typeDairy
- Page 161 and 162: Reference Jensen 2004Food typeDairy
- Page 163 and 164: Reference Knox 1972Food typeDairy f
- Page 165 and 166: Reference Lagiou 2006Food typeDairy
- Page 167 and 168: Reference Latva-Pukkila 2009Dietary
- Page 169 and 170: difference between total allergy in
- Page 171 and 172:
Reference Mannion 2006Food typeDair
- Page 173 and 174:
Calcium supplementationNo ŧ 77 1.0
- Page 175 and 176:
Reference Miyake 2006Food groupsDai
- Page 177 and 178:
Reference Nwaru 2010Food typeDairy
- Page 179 and 180:
Reference Olafsdottir 2006Dietary p
- Page 181 and 182:
P for trend 4 6 glasses of milk/d h
- Page 183 and 184:
Reference Petridou 2005Food typeMil
- Page 185 and 186:
Reference Richardson 1995Food typeM
- Page 187 and 188:
Reference Saito 2010Food typeDairy
- Page 189 and 190:
Reference Stuebe 2009Dietary patter
- Page 191 and 192:
Women in the supplemented group int
- Page 193 and 194:
Reference Willers 2007Food typeDair
- Page 195 and 196:
Reference Yin 2010 (see also Jones
- Page 197 and 198:
Jensen CD, Block G, Buffler P, Ma X
- Page 199 and 200:
Included StudiesDairy foods and egg
- Page 201 and 202:
Evidence TablesReference Cant 1986F
- Page 203 and 204:
Reference Lilja 1988 (1989, 1991) -
- Page 205 and 206:
Tumour SubtypesAstrocytomasPilocyti
- Page 207 and 208:
Included StudiesEggsStudyOutcomes1.
- Page 209 and 210:
11. In a cohort study from the Neth
- Page 211 and 212:
Reference George 2005Food typeEggsS
- Page 213 and 214:
Reference Haggarty 2009Dietary patt
- Page 215 and 216:
Reference Jensen 2004Food typeEggsS
- Page 217 and 218:
Reference Maconochie 2007Food group
- Page 219 and 220:
Reference Nwaru 2010Food typeEggsSt
- Page 221 and 222:
Reference Sausenthaler 2007Food gro
- Page 223 and 224:
Reference Willers 2008Food typeEggs
- Page 225 and 226:
Included StudiesFats and OilsStudyO
- Page 227 and 228:
11. In an Italian case-control stud
- Page 229 and 230:
Evidence TablesReference Calvani 20
- Page 231 and 232:
Reference Fard 2004Dietary patterns
- Page 233 and 234:
Reference George 2005Food typeFoods
- Page 235 and 236:
Risk of bias Moderate risk of bias:
- Page 237 and 238:
Reference Haggarty 2009Dietary patt
- Page 239 and 240:
Reference Khoury 2007Food type“Ch
- Page 241 and 242:
Reference Mellies 1978; 1979Dietary
- Page 243 and 244:
Reference Nwaru 2010Food typeFats a
- Page 245 and 246:
Reference Petridou 1998Food typeFat
- Page 247 and 248:
Reference Signorello 1998Food group
- Page 249 and 250:
Reference Willers 2007Food typeFats
- Page 251 and 252:
Petridou E, Koussouri M, Toupadaki
- Page 253 and 254:
30. Miyake 2006 Postpartum depressi
- Page 255 and 256:
Evidence SummaryPre-Pregnancy1. In
- Page 257 and 258:
canned tuna (p = 0.01 for weight) b
- Page 259 and 260:
1.02 95% CI 0.82 to 1.2635. In a Ja
- Page 261 and 262:
Maternal Outcomes - Postnatal54. In
- Page 263 and 264:
Evidence TablesReference Akre 2008F
- Page 265 and 266:
Reference Buck 2003Food typeFishStu
- Page 267 and 268:
Reference Calvani 2006Food typeFish
- Page 269 and 270:
Reference Chatzi 2008Food typeFishS
- Page 271 and 272:
Vocabulary comprehension 1 0.8 (0.6
- Page 273 and 274:
Oily fish consumption Never
- Page 275 and 276:
Reference Giordano 2008Food typeFis
- Page 277 and 278:
Reference Golding 2009Food typeFish
- Page 279 and 280:
Reference Haggarty 2009Dietary patt
- Page 281 and 282:
Reference Halldorsson 2008Food grou
- Page 283 and 284:
Reference Hibbeln 2007Food groupsSe
- Page 285 and 286:
Reference Jedrychowski 2010Dietary
- Page 287 and 288:
Reference Jensen 2004Food typeFish:
- Page 289 and 290:
Reference Lamb 2008Dietary patterns
- Page 291 and 292:
Reference Lauritzen 2005a; Lauritze
- Page 293 and 294:
Reference Maconochie 2007Food group
- Page 295 and 296:
Reference Mendez 2009Food groupsFis
- Page 297 and 298:
Reference Mitchell 2004Dietary patt
- Page 299 and 300:
Reference Miyake 2006Food groupsFis
- Page 301 and 302:
Reference Oien 2010Food typeFish:St
- Page 303 and 304:
Risk of biasRelevanceOther comments
- Page 305 and 306:
Reference Oken 2007Food typeFishStu
- Page 307 and 308:
Reference Oken 2004Food typeFish (c
- Page 309 and 310:
Reference Olsen 1993Food typeFishSt
- Page 311 and 312:
All 6517 282.1 [10.4]Multiple regre
- Page 313 and 314:
ReferenceFood typeStudy typeLevel o
- Page 315 and 316:
Other typesMalignant gliomas(122 ca
- Page 317 and 318:
Follow-upConfoundingRisk of biasRel
- Page 319 and 320:
Reference Romieu 2007Food typeFishS
- Page 321 and 322:
Reference Salam 2005Food typeFishSt
- Page 323 and 324:
Reference Sausenthaler 2007Food gro
- Page 325 and 326:
Reference Shiell 2001Food groupsFis
- Page 327 and 328:
Reference Strain 2008; Davidson 200
- Page 329 and 330:
RelevanceOther commentsoutcomes.Tho
- Page 331 and 332:
Risk of biasRelevanceOther comments
- Page 333 and 334:
12 years 331 0.69 0.03 015 years
- Page 335 and 336:
Reference Willers 2007Food typeFish
- Page 337 and 338:
Reference Willers 2008Food typeFish
- Page 339 and 340:
Follow-upConfoundingRisk of biasRel
- Page 341 and 342:
Reference Yin 2010 (see also Jones
- Page 343 and 344:
Haggarty P, Campbell DM, Duthie S,
- Page 345 and 346:
Oken E, Radesky JS, Wright RO, Bell
- Page 347 and 348:
Included StudiesFruitFruitStudyOutc
- Page 349 and 350:
and canned peaches, pears, pineappl
- Page 351 and 352:
0.22 to 0.70)24. In a North America
- Page 353 and 354:
2-4/wk 133 0.8 (0.5 to 1.2) 124 0.7
- Page 355 and 356:
Reference Chatzi 2008Food typeFruit
- Page 357 and 358:
Reference Giordano 2010Food typeFru
- Page 359 and 360:
Reference Haggarty 2009Dietary patt
- Page 361 and 362:
Reference Jones 2000 (see also Yin
- Page 363 and 364:
Reference Knox 1972Food typeFruit:
- Page 365 and 366:
Reference Lamb 2008Dietary patterns
- Page 367 and 368:
Reference Li 2009Dietary patterns F
- Page 369 and 370:
Reference Mikkelsen 2006Food typeFr
- Page 371 and 372:
Reference Miyake 2010Food typeFruit
- Page 373 and 374:
Risk of biasRelevanceOther comments
- Page 375 and 376:
Reference Petridou 1998Food typeFru
- Page 377 and 378:
RelevanceOther commentsMore general
- Page 379 and 380:
Reference Willers 2007Food typeFrui
- Page 381 and 382:
Reference Willers 2008Food typeFrui
- Page 383 and 384:
Reference Zhang 2006Food typeFruit
- Page 385 and 386:
ReferencesBunin GR, Kushi LH, Galla
- Page 387 and 388:
Included StudiesFruit & VegetablesS
- Page 389 and 390:
9. In a US case-control study, mate
- Page 391 and 392:
Other commentsFat consisted of pure
- Page 393 and 394:
Reference Hoppu 2005Dietary pattern
- Page 395 and 396:
Reference Li 2009Dietary patterns F
- Page 397 and 398:
Reference Mikkelsen 2006Food typeFr
- Page 399 and 400:
Reference Spector 2005Dietary patte
- Page 401 and 402:
ReferencesFitzsimon N, Fallon U, O'
- Page 403 and 404:
Evidence StatementsMaternal Outcome
- Page 405 and 406:
Evidence TablesReference Bunin 2005
- Page 407 and 408:
Reference Giordano 2008Food typeLeg
- Page 409 and 410:
Reference Knox 1972Food typeLegumes
- Page 411 and 412:
Reference Maconochie 2007Food group
- Page 413 and 414:
Reference Pierik 2004Food typeSoy p
- Page 415 and 416:
MeatIncluded StudiesStudyOutcomes1.
- Page 417 and 418:
Evidence SummariesMaternal Outcomes
- Page 419 and 420:
17. In a follow-up study of Saito 2
- Page 421 and 422:
Evidence TablesReference Akre 2008F
- Page 425 and 426:
Reference Bunin 1993Food typeCured
- Page 427 and 428:
Reference George 2005Food typeMeat
- Page 429 and 430:
Reference Giordano 2008Food typeMea
- Page 431 and 432:
Reference Godfrey 1996Food typeMeat
- Page 433 and 434:
Reference Jensen 2004Food typeMeat:
- Page 435 and 436:
Reference Knox 1972Food typeMeat (t
- Page 437 and 438:
Reference Lamb 2008Dietary patterns
- Page 439 and 440:
Reference Maconochie 2007Food group
- Page 441 and 442:
Reference Mitchell 2004Dietary patt
- Page 443 and 444:
Reference Miyake 2006Food groupsMea
- Page 445 and 446:
Reference Petridou 2005Food typeMea
- Page 447 and 448:
Reference Pogoda 2009Food typeMeat:
- Page 449 and 450:
Reference Pogoda 2001Food typeCured
- Page 451 and 452:
Reference Radesky 2008Food typeMeat
- Page 453 and 454:
Reference Sarasua 1994Food typeMeat
- Page 455 and 456:
Reference Shiell 2001Food groupsMea
- Page 457 and 458:
Reference Yin 2010 (see also Jones
- Page 459 and 460:
Number of cases of GDM 328 333 97Pe
- Page 461 and 462:
Latva-Pukkila U, Isolauri E and Lai
- Page 463 and 464:
Included StudiesNuts and SeedsStudy
- Page 465 and 466:
Evidence TablesReference Chatzi 200
- Page 467 and 468:
Reference Hourihane 1996Dietary pat
- Page 469 and 470:
Reference Sausenthaler 2007Food gro
- Page 471 and 472:
Reference Vadas 2001Food groupsPean
- Page 473 and 474:
Reference Willers 2008Food typeNuts
- Page 475 and 476:
ReferencesChatzi L, Torrent M, Romi
- Page 477 and 478:
Evidence summariesMaternal Outcomes
- Page 479 and 480:
Reference Duley 1999 and 2005Food t
- Page 481 and 482:
Reference Morris 2001Food typeSaltS
- Page 483 and 484:
Included StudiesSugarStudyOutcomes1
- Page 485 and 486:
years of ageOther Childhood Outcome
- Page 487 and 488:
Risk of biasRelevanceOther comments
- Page 489 and 490:
Reference Haggarty 2009Dietary patt
- Page 491 and 492:
Reference Kwan 2009Food typeSugar (
- Page 493 and 494:
Reference Lenders 1996Food groupssu
- Page 495 and 496:
Reference Olafsdottir 2006Dietary p
- Page 497 and 498:
ReferenceFood typeStudy typeLevel o
- Page 499 and 500:
Reference Stuebe 2009Dietary patter
- Page 501 and 502:
Included StudiesVegetablesVegetable
- Page 503 and 504:
Evidence StatementsMaternal Outcome
- Page 505 and 506:
15. In a German cohort study:Allerg
- Page 507 and 508:
29. In one Australian cohort study
- Page 509 and 510:
RelevanceOther commentseducation, c
- Page 511 and 512:
Reference George 2005Food typeVeget
- Page 513 and 514:
Reference Giordano 2008Food typeVeg
- Page 515 and 516:
Reference Herrick 2003Food groupsVe
- Page 517 and 518:
Reference Jones 2000 (see also Yin
- Page 519 and 520:
Reference Kwan 2009Food typeVegetab
- Page 521 and 522:
Reference Lamb 2008Dietary patterns
- Page 523 and 524:
Reference Li 2009Dietary patterns V
- Page 525 and 526:
Reference Mikkelsen 2006Food typeFr
- Page 527 and 528:
Reference Miyake 2010Food typeFruit
- Page 529 and 530:
Reference Oien 2010Food typeVegetab
- Page 531 and 532:
Reference Pierik 2004Food typeVeget
- Page 533 and 534:
Q3 332 (15%) 94 (16%) 0.9 (0.8 to 1
- Page 535 and 536:
Reference Ramon 2009Food typeVegeta
- Page 537 and 538:
Reference Sausenthaler 2007Food gro
- Page 539 and 540:
Reference Willers 2007Food typeVege
- Page 541 and 542:
Reference Yin 2010 (see also Jones
- Page 543 and 544:
RelevanceOther commentsLikely to be
- Page 545 and 546:
Mitchell EA, Robinson E, Clark PM,
- Page 547 and 548:
ReferencesNarrative review1. Jackso
- Page 549 and 550:
29. Brion MJ, Leary SD, Smith GD, M
- Page 551 and 552:
59. Scholl TO, Chen X, Khoo CS and
- Page 553 and 554:
87. Olafsdottir AS, Magnusardottir
- Page 555:
Excluded Studies555