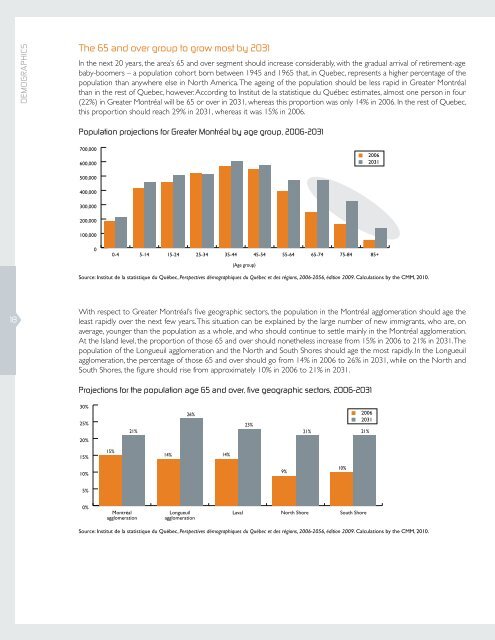
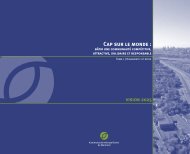
DemographicsThe 65 and over group to grow most by 2031In <strong>the</strong> next 20 years, <strong>the</strong> area’s 65 and over segment should increase considerably, with <strong>the</strong> gradual arrival <strong>of</strong> retirement-agebaby-boomers – a population cohort born between 1945 and 1965 that, in Quebec, represents a higher percentage <strong>of</strong> <strong>the</strong>population than anywhere else in North America. The ageing <strong>of</strong> <strong>the</strong> population should be less rapid in <strong>Greater</strong> Montréalthan in <strong>the</strong> rest <strong>of</strong> Quebec, however. According to Institut de la statistique du Québec estimates, almost one person in four(22%) in <strong>Greater</strong> Montréal will be 65 or over in 2031, whereas this proportion was only 14% in 2006. In <strong>the</strong> rest <strong>of</strong> Quebec,this proportion should reach 29% in 2031, whereas it was 15% in 2006.Population projections for <strong>Greater</strong> Montréal by age group, 2006-2031700,000600,00020062031500,000400,000300,000200,000100,00000-45-1415-2425-3435-4445-5455-6465-7475-8485+(Age group)Source: Institut de la statistique du Québec, Perspectives démographiques du Québec et des régions, 2006-2056, édition 2009. Calculations by <strong>the</strong> CMM, <strong>2010</strong>.18With respect to <strong>Greater</strong> Montréal’s five geographic sectors, <strong>the</strong> population in <strong>the</strong> Montréal agglomeration should age <strong>the</strong>least rapidly over <strong>the</strong> next few years. This situation can be explained by <strong>the</strong> large number <strong>of</strong> new immigrants, who are, onaverage, younger than <strong>the</strong> population as a whole, and who should continue to settle mainly in <strong>the</strong> Montréal agglomeration.At <strong>the</strong> Island level, <strong>the</strong> proportion <strong>of</strong> those 65 and over should none<strong>the</strong>less increase from 15% in 2006 to 21% in 2031. Thepopulation <strong>of</strong> <strong>the</strong> Longueuil agglomeration and <strong>the</strong> North and South Shores should age <strong>the</strong> most rapidly. In <strong>the</strong> Longueuilagglomeration, <strong>the</strong> percentage <strong>of</strong> those 65 and over should go from 14% in 2006 to 26% in 2031, while on <strong>the</strong> North andSouth Shores, <strong>the</strong> figure should rise from approximately 10% in 2006 to 21% in 2031.Projections for <strong>the</strong> population age 65 and over, five geographic sectors, 2006-203130%25%21%26%23%21%2006203121%20%15%15%14%14%10%9%10%5%0%MontréalagglomerationLongueuilagglomerationLavalNorth ShoreSouth ShoreSource: Institut de la statistique du Québec, Perspectives démographiques du Québec et des régions, 2006-2056, édition 2009. Calculations by <strong>the</strong> CMM, <strong>2010</strong>.
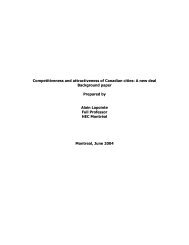
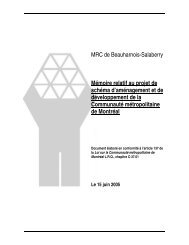
2.6 LanguageFrench declines as <strong>the</strong> main languagespoken at home, but rises as <strong>the</strong> mainlanguage used at workIn <strong>Greater</strong> Montréal, <strong>the</strong> <strong>of</strong>ficial language, French, is <strong>the</strong>main language spoken at home by just over two-thirds <strong>of</strong><strong>the</strong> population. As is true for o<strong>the</strong>r large North Americanmetropolitan areas, because <strong>of</strong> historical context andimmigration, in addition to <strong>of</strong>ficial languages, several o<strong>the</strong>rlanguages are also used as <strong>the</strong> main language at home.In <strong>Greater</strong> Montréal, English also has an important presence,and is <strong>the</strong> main language spoken at home by about 17% <strong>of</strong><strong>the</strong> population. Nearly 12% <strong>of</strong> <strong>the</strong> population has a languageo<strong>the</strong>r than French or English as <strong>the</strong> main language used athome, and approximately 4% <strong>of</strong> <strong>the</strong> population speaks morethan one language at home fluently.Between 2001 and 2006, as a result <strong>of</strong> internationalimmigration, <strong>the</strong> percentage <strong>of</strong> <strong>the</strong> population speakingFrench as <strong>the</strong> main language at home, or whose mo<strong>the</strong>rtongue is French, declined slightly to <strong>the</strong> benefit <strong>of</strong> languageso<strong>the</strong>r than English. The proportion <strong>of</strong> <strong>the</strong> bilingual population(English-French) also decreased somewhat. However, <strong>the</strong>percentage <strong>of</strong> people using French as <strong>the</strong> main language atwork rose, from 71% to 72% between 2001 and 2006 – anincrease explained, in particular, by <strong>the</strong> strong growth <strong>of</strong>immigrants with Arabic as <strong>the</strong>ir mo<strong>the</strong>r tongue, who tendto use French as <strong>the</strong>ir working language. 4Percentage <strong>of</strong> <strong>the</strong> population whose mainlanguage spoken at home is French only(<strong>Greater</strong> Montréal and Québec area) or English only(o<strong>the</strong>r areas), 2006QuébecCincinnatiPittsburghSt. LouisClevelandBaltimoreEdmontonDetroitMinneapolisPhiladelphiaCalgaryAtlantaPortlandTampaSeattleDenverBostonWashingtonSacramentoPhoenixChicagoDallasVancouverToronto<strong>Greater</strong> Montréal67.9%San DiegoHoustonNew YorkRiversideSan FranciscoOttawa-GatineauMiamiLos Angeles0% 20% 40% 60% 80% 100%N.B.: For <strong>Greater</strong> Montréal, data are at <strong>the</strong> CMA level.Sources: Statistics Canada, Census <strong>of</strong> Population 2006; US Census Bureau, AmericanCommunity Survey, 2006. Calculations by <strong>the</strong> CMM, <strong>2010</strong>.demographics19Use <strong>of</strong> French in <strong>Greater</strong> Montréal, 2001 and 200680%70%67,5%64,9%69,4% 67,9%2001 200671,2% 72,1%60%50%52,9% 51,9%40%30%20%10%0%Population with Frenchonly as mo<strong>the</strong>r tonguePopulation whose languagemost <strong>of</strong>ten spoken at homeis French onlyBilingual population(population with a knowledge<strong>of</strong> French and English)People whose languagemost <strong>of</strong>ten spoken at workis French onlyN.B.: Data are at <strong>the</strong> Montréal CMA level.Source: Statistics Canada, Census <strong>of</strong> Population 2001 and 2006. Calculations by <strong>the</strong> CMM, <strong>2010</strong>.4 Statistics Canada, Using Languages at Work in Canada, 2006 Census (<strong>2010</strong>).