Portrait of the Greater Montréal, 2010 edition - Communauté ...
Portrait of the Greater Montréal, 2010 edition - Communauté ...
Portrait of the Greater Montréal, 2010 edition - Communauté ...

You also want an ePaper? Increase the reach of your titles
YUMPU automatically turns print PDFs into web optimized ePapers that Google loves.
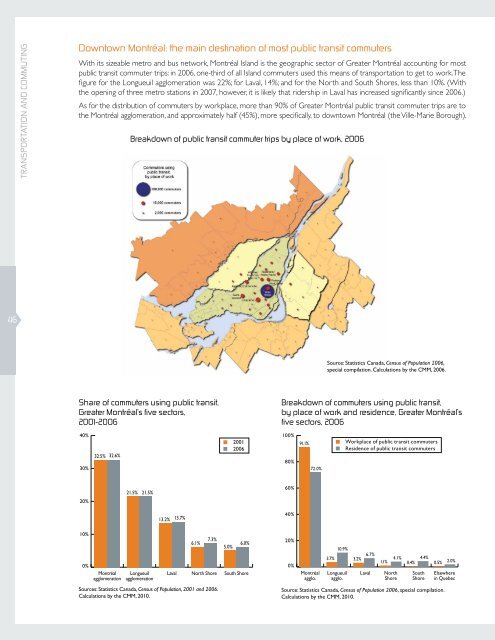
TRANSPORTATION AND COMMUTINGDowntown Montréal: <strong>the</strong> main destination <strong>of</strong> most public transit commutersWith its sizeable metro and bus network, Montréal Island is <strong>the</strong> geographic sector <strong>of</strong> <strong>Greater</strong> Montréal accounting for mostpublic transit commuter trips: in 2006, one-third <strong>of</strong> all Island commuters used this means <strong>of</strong> transportation to get to work. Thefigure for <strong>the</strong> Longueuil agglomeration was 22%; for Laval, 14%; and for <strong>the</strong> North and South Shores, less than 10%. (With<strong>the</strong> opening <strong>of</strong> three metro stations in 2007, however, it is likely that ridership in Laval has increased significantly since 2006.)As for <strong>the</strong> distribution <strong>of</strong> commuters by workplace, more than 90% <strong>of</strong> <strong>Greater</strong> Montréal public transit commuter trips are to<strong>the</strong> Montréal agglomeration, and approximately half (45%), more specifically, to downtown Montréal (<strong>the</strong> Ville-Marie Borough).Breakdown <strong>of</strong> public transit commuter trips by place <strong>of</strong> work, 200646Source: Statistics Canada, Census <strong>of</strong> Population 2006,special compilation. Calculations by <strong>the</strong> CMM, 2006.Share <strong>of</strong> commuters using public transit,<strong>Greater</strong> Montréal’s five sectors,2001-2006Breakdown <strong>of</strong> commuters using public transit,by place <strong>of</strong> work and residence, <strong>Greater</strong> Montréal’sfive sectors, 200640%30%32.5% 32.6%20012006100%80%91.1%72.0%Workplace <strong>of</strong> public transit commutersResidence <strong>of</strong> public transit commuters20%21.5% 21.5%60%40%10%0%MontréalagglomerationLongueuilagglomeration13.2% 13.7% 6.1%Laval7.3%North ShoreSources: Statistics Canada, Census <strong>of</strong> Population, 2001 and 2006.Calculations by <strong>the</strong> CMM, <strong>2010</strong>.5.0%6.0%South Shore20%0%Montréalagglo.3.7%10.9%Longueuilagglo.3.2% 6.7%Laval1.1%4.1%NorthShore0.4%4.4%SouthShore0.5% 2.0%Elsewherein QuebecSource: Statistics Canada, Census <strong>of</strong> Population 2006, special compilation.Calculations by <strong>the</strong> CMM, <strong>2010</strong>.