Portrait of the Greater Montréal, 2010 edition - Communauté ...
Portrait of the Greater Montréal, 2010 edition - Communauté ...
Portrait of the Greater Montréal, 2010 edition - Communauté ...

You also want an ePaper? Increase the reach of your titles
YUMPU automatically turns print PDFs into web optimized ePapers that Google loves.
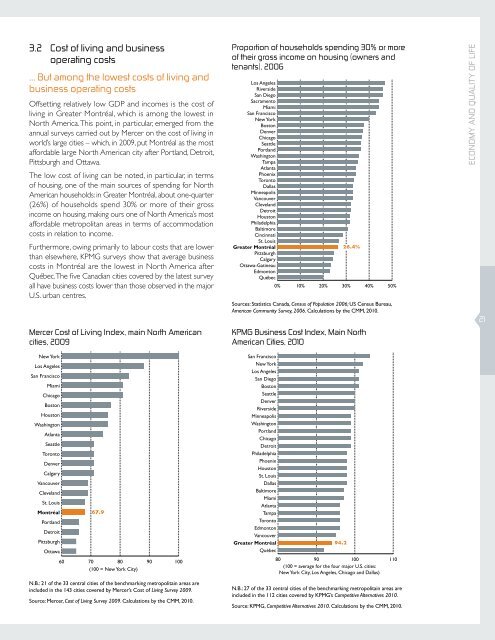
3.2 Cost <strong>of</strong> living and businessoperating costs... But among <strong>the</strong> lowest costs <strong>of</strong> living andbusiness operating costsOffsetting relatively low GDP and incomes is <strong>the</strong> cost <strong>of</strong>living in <strong>Greater</strong> Montréal, which is among <strong>the</strong> lowest inNorth America. This point, in particular, emerged from <strong>the</strong>annual surveys carried out by Mercer on <strong>the</strong> cost <strong>of</strong> living inworld’s large cities – which, in 2009, put Montréal as <strong>the</strong> mostaffordable large North American city after Portland, Detroit,Pittsburgh and Ottawa.The low cost <strong>of</strong> living can be noted, in particular, in terms<strong>of</strong> housing, one <strong>of</strong> <strong>the</strong> main sources <strong>of</strong> spending for NorthAmerican households: in <strong>Greater</strong> Montréal, about one-quarter(26%) <strong>of</strong> households spend 30% or more <strong>of</strong> <strong>the</strong>ir grossincome on housing, making ours one <strong>of</strong> North America’s mostaffordable metropolitan areas in terms <strong>of</strong> accommodationcosts in relation to income.Fur<strong>the</strong>rmore, owing primarily to labour costs that are lowerthan elsewhere, KPMG surveys show that average businesscosts in Montréal are <strong>the</strong> lowest in North America afterQuébec. The five Canadian cities covered by <strong>the</strong> latest surveyall have business costs lower than those observed in <strong>the</strong> majorU.S. urban centres.Mercer Cost <strong>of</strong> Living Index, main North Americancities, 2009New YorkLos AngelesSan FranciscoMiamiChicagoBostonHoustonWashingtonAtlantaSeattleTorontoDenverCalgaryVancouverClevelandSt. LouisMontréalPortlandDetroitPittsburghOttawa67.960 70 80 90 100(100 = New York City)N.B.: 21 <strong>of</strong> <strong>the</strong> 33 central cities <strong>of</strong> <strong>the</strong> benchmarking metropolitain areas areincluded in <strong>the</strong> 143 cities covered by Mercer’s Cost <strong>of</strong> Living Survey 2009.Source: Mercer, Cost <strong>of</strong> Living Survey 2009. Calculations by <strong>the</strong> CMM, <strong>2010</strong>.Proportion <strong>of</strong> households spending 30% or more<strong>of</strong> <strong>the</strong>ir gross income on housing (owners andtenants), 2006Los AngelesRiversideSan DiegoSacramentoMiamiSan FranciscoNew YorkBostonDenverChicagoSeattlePortlandWashingtonTampaAtlantaPhoenixTorontoDallasMinneapolisVancouverClevelandDetroitHoustonPhiladelphiaBaltimoreCincinnatiSt. Louis<strong>Greater</strong> Montréal26.4%PittsburghCalgaryOttawa-GatineauEdmontonQuébec0% 10% 20% 30% 40% 50%Sources: Statistics Canada, Census <strong>of</strong> Population 2006; US Census Bureau,American Community Survey, 2006. Calculations by <strong>the</strong> CMM, <strong>2010</strong>.KPMG Business Cost Index, Main NorthAmerican Cities, <strong>2010</strong>San FranciscoNew YorkLos AngelesSan DiegoBostonSeattleDenverRiversideMinneapolisWashingtonPortlandChicagoDetroitPhiladelphiaPhoenixHoustonSt. LouisDallasBaltimoreMiamiAtlantaTampaTorontoEdmontonVancouver<strong>Greater</strong> Montréal94.2Québec80 90 100 110(100 = average for <strong>the</strong> four major U.S. cities:New York City, Los Angeles, Chicago and Dallas)N.B.: 27 <strong>of</strong> <strong>the</strong> 33 central cities <strong>of</strong> <strong>the</strong> benchmarking metropolitain areas areincluded in <strong>the</strong> 112 cities covered by KPMG’s Competitive Alternatives <strong>2010</strong>.Source: KPMG, Competitive Alternatives <strong>2010</strong>. Calculations by <strong>the</strong> CMM, <strong>2010</strong>.ECONOMY AND QUALITY OF LIFe21