Portrait of the Greater Montréal, 2010 edition - Communauté ...
Portrait of the Greater Montréal, 2010 edition - Communauté ...
Portrait of the Greater Montréal, 2010 edition - Communauté ...

Create successful ePaper yourself
Turn your PDF publications into a flip-book with our unique Google optimized e-Paper software.
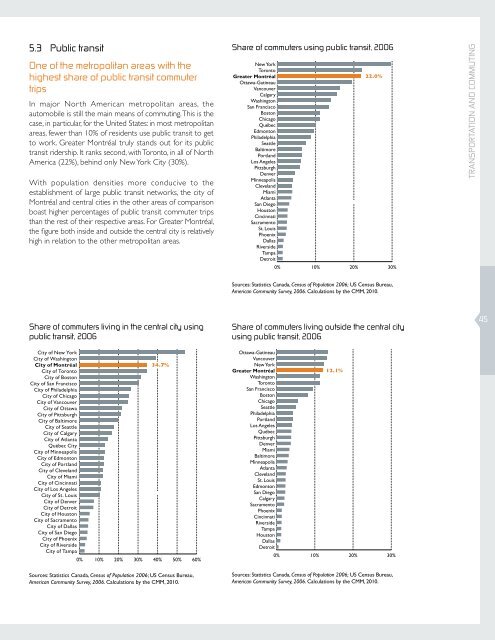
5.3 Public transitOne <strong>of</strong> <strong>the</strong> metropolitan areas with <strong>the</strong>highest share <strong>of</strong> public transit commutertripsIn major North American metropolitan areas, <strong>the</strong>automobile is still <strong>the</strong> main means <strong>of</strong> commuting. This is <strong>the</strong>case, in particular, for <strong>the</strong> United States: in most metropolitanareas, fewer than 10% <strong>of</strong> residents use public transit to getto work. <strong>Greater</strong> Montréal truly stands out for its publictransit ridership. It ranks second, with Toronto, in all <strong>of</strong> NorthAmerica (22%), behind only New York City (30%).With population densities more conducive to <strong>the</strong>establishment <strong>of</strong> large public transit networks, <strong>the</strong> city <strong>of</strong>Montréal and central cities in <strong>the</strong> o<strong>the</strong>r areas <strong>of</strong> comparisonboast higher percentages <strong>of</strong> public transit commuter tripsthan <strong>the</strong> rest <strong>of</strong> <strong>the</strong>ir respective areas. For <strong>Greater</strong> Montréal,<strong>the</strong> figure both inside and outside <strong>the</strong> central city is relativelyhigh in relation to <strong>the</strong> o<strong>the</strong>r metropolitan areas.Share <strong>of</strong> commuters using public transit, 2006New YorkToronto<strong>Greater</strong> Montréal22.0%Ottawa-GatineauVancouverCalgaryWashingtonSan FranciscoBostonChicagoQuébecEdmontonPhiladelphiaSeattleBaltimorePortlandLos AngelesPittsburghDenverMinneapolisClevelandMiamiAtlantaSan DiegoHoustonCincinnatiSacramentoSt. LouisPhoenixDallasRiversideTampaDetroit0% 10% 20% 30%TRANSPORTATION AND COMMUTINGSources: Statistics Canada, Census <strong>of</strong> Population 2006; US Census Bureau,American Community Survey, 2006. Calculations by <strong>the</strong> CMM, <strong>2010</strong>.Share <strong>of</strong> commuters living in <strong>the</strong> central city usingpublic transit, 2006City <strong>of</strong> New YorkCity <strong>of</strong> WashingtonCity <strong>of</strong> Montréal34.7%City <strong>of</strong> TorontoCity <strong>of</strong> BostonCity <strong>of</strong> San FranciscoCity <strong>of</strong> PhiladelphiaCity <strong>of</strong> ChicagoCity <strong>of</strong> VancouverCity <strong>of</strong> OttawaCity <strong>of</strong> PittsburghCity <strong>of</strong> BaltimoreCity <strong>of</strong> SeattleCity <strong>of</strong> CalgaryCity <strong>of</strong> AtlantaQuébec CityCity <strong>of</strong> MinneapolisCity <strong>of</strong> EdmontonCity <strong>of</strong> PortlandCity <strong>of</strong> ClevelandCity <strong>of</strong> MiamiCity <strong>of</strong> CincinnatiCity <strong>of</strong> Los AngelesCity <strong>of</strong> St. LouisCity <strong>of</strong> DenverCity <strong>of</strong> DetroitCity <strong>of</strong> HoustonCity <strong>of</strong> SacramentoCity <strong>of</strong> DallasCity <strong>of</strong> San DiegoCity <strong>of</strong> PhoenixCity <strong>of</strong> RiversideCity <strong>of</strong> Tampa0% 10% 20% 30% 40% 50% 60%Sources: Statistics Canada, Census <strong>of</strong> Population 2006; US Census Bureau,American Community Survey, 2006. Calculations by <strong>the</strong> CMM, <strong>2010</strong>.Share <strong>of</strong> commuters living outside <strong>the</strong> central cityusing public transit, 2006Ottawa-GatineauVancouverNew York<strong>Greater</strong> Montréal12.1%WashingtonTorontoSan FranciscoBostonChicagoSeattlePhiladelphiaPortlandLos AngelesQuébecPittsburghDenverMiamiBaltimoreMinneapolisAtlantaClevelandSt. LouisEdmontonSan DiegoCalgarySacramentoPhoenixCincinnatiRiversideTampaHoustonDallasDetroit0% 10% 20% 30%Sources: Statistics Canada, Census <strong>of</strong> Population 2006; US Census Bureau,American Community Survey, 2006. Calculations by <strong>the</strong> CMM, <strong>2010</strong>.45