Portrait of the Greater Montréal, 2010 edition - Communauté ...
Portrait of the Greater Montréal, 2010 edition - Communauté ...
Portrait of the Greater Montréal, 2010 edition - Communauté ...

You also want an ePaper? Increase the reach of your titles
YUMPU automatically turns print PDFs into web optimized ePapers that Google loves.
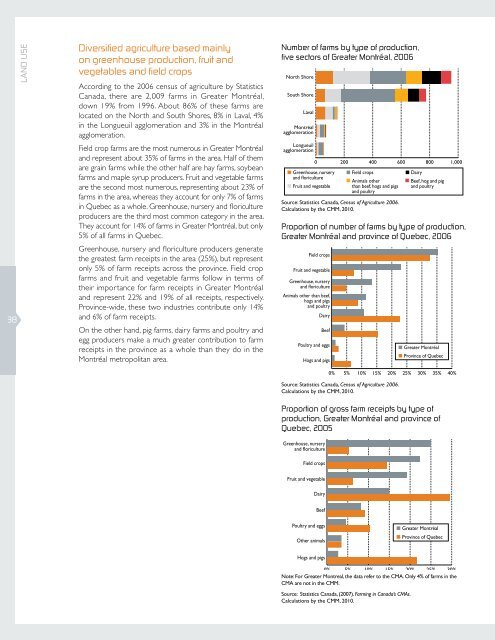
38land useDiversified agriculture based mainlyon greenhouse production, fruit andvegetables and field cropsAccording to <strong>the</strong> 2006 census <strong>of</strong> agriculture by StatisticsCanada, <strong>the</strong>re are 2,009 farms in <strong>Greater</strong> Montréal,down 19% from 1996. About 86% <strong>of</strong> <strong>the</strong>se farms arelocated on <strong>the</strong> North and South Shores, 8% in Laval, 4%in <strong>the</strong> Longueuil agglomeration and 3% in <strong>the</strong> Montréalagglomeration.Field crop farms are <strong>the</strong> most numerous in <strong>Greater</strong> Montréaland represent about 35% <strong>of</strong> farms in <strong>the</strong> area. Half <strong>of</strong> <strong>the</strong>mare grain farms while <strong>the</strong> o<strong>the</strong>r half are hay farms, soybeanfarms and maple syrup producers. Fruit and vegetable farmsare <strong>the</strong> second most numerous, representing about 23% <strong>of</strong>farms in <strong>the</strong> area, whereas <strong>the</strong>y account for only 7% <strong>of</strong> farmsin Quebec as a whole. Greenhouse, nursery and floricultureproducers are <strong>the</strong> third most common category in <strong>the</strong> area.They account for 14% <strong>of</strong> farms in <strong>Greater</strong> Montréal, but only5% <strong>of</strong> all farms in Quebec.Greenhouse, nursery and floriculture producers generate<strong>the</strong> greatest farm receipts in <strong>the</strong> area (25%), but representonly 5% <strong>of</strong> farm receipts across <strong>the</strong> province. Field cropfarms and fruit and vegetable farms follow in terms <strong>of</strong><strong>the</strong>ir importance for farm receipts in <strong>Greater</strong> Montréaland represent 22% and 19% <strong>of</strong> all receipts, respectively.Province-wide, <strong>the</strong>se two industries contribute only 14%and 6% <strong>of</strong> farm receipts.On <strong>the</strong> o<strong>the</strong>r hand, pig farms, dairy farms and poultry andegg producers make a much greater contribution to farmreceipts in <strong>the</strong> province as a whole than <strong>the</strong>y do in <strong>the</strong>Montréal metropolitan area.Number <strong>of</strong> farms by type <strong>of</strong> production,five sectors <strong>of</strong> <strong>Greater</strong> Montréal, 2006North ShoreSouth ShoreLavalMontréalagglomerationLongueuilagglomeration0 200 400 600 800 1,000Field cropsDairyGreenhouse, nurseryand floricultureFruit and vegetableAnimals o<strong>the</strong>rthan beef, hogs and pigsand poultrySource: Statistics Canada, Census <strong>of</strong> Agriculture 2006.Calculations by <strong>the</strong> CMM, <strong>2010</strong>.Beef, hog and pigand poultryProportion <strong>of</strong> number <strong>of</strong> farms by type <strong>of</strong> production,<strong>Greater</strong> Montréal and province <strong>of</strong> Quebec, 2006Field cropsFruit and vegetableGreenhouse, nurseryand floricultureAnimals o<strong>the</strong>r than beef,hogs and pigsand poultryDairyBeefPoultry and eggsHogs and pigs<strong>Greater</strong> MontréalProvince <strong>of</strong> Quebec0% 5% 10% 15% 20% 25% 30% 35% 40%Source: Statistics Canada, Census <strong>of</strong> Agriculture 2006.Calculations by <strong>the</strong> CMM, <strong>2010</strong>.Proportion <strong>of</strong> gross farm receipts by type <strong>of</strong>production, <strong>Greater</strong> Montréal and province <strong>of</strong>Quebec, 2005Greenhouse, nurseryand floricultureField cropsFruit and vegetableDairyBeefPoultry and eggsO<strong>the</strong>r animals<strong>Greater</strong> MontréalProvince <strong>of</strong> QuebecHogs and pigs0% 5% 10% 15% 20% 25% 30%Note: For <strong>Greater</strong> Montreal, <strong>the</strong> data refer to <strong>the</strong> CMA. Only 4% <strong>of</strong> farms in <strong>the</strong>CMA are not in <strong>the</strong> CMM.Source: Statistics Canada, (2007). Farming in Canada’s CMAs.Calculations by <strong>the</strong> CMM, <strong>2010</strong>.