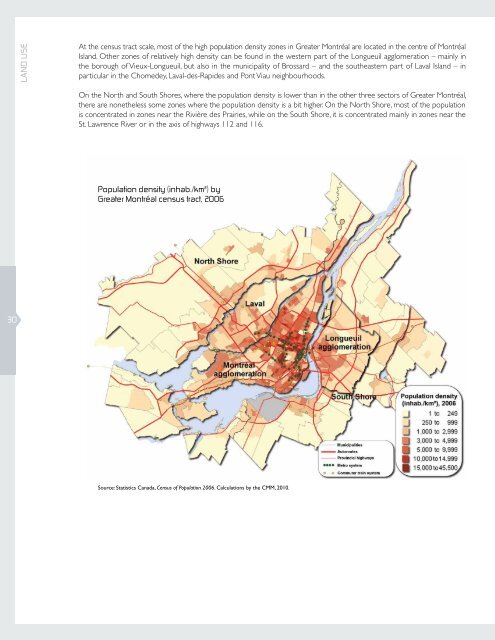
land useAt <strong>the</strong> census tract scale, most <strong>of</strong> <strong>the</strong> high population density zones in <strong>Greater</strong> Montréal are located in <strong>the</strong> centre <strong>of</strong> MontréalIsland. O<strong>the</strong>r zones <strong>of</strong> relatively high density can be found in <strong>the</strong> western part <strong>of</strong> <strong>the</strong> Longueuil agglomeration – mainly in<strong>the</strong> borough <strong>of</strong> Vieux-Longueuil, but also in <strong>the</strong> municipality <strong>of</strong> Brossard – and <strong>the</strong> sou<strong>the</strong>astern part <strong>of</strong> Laval Island – inparticular in <strong>the</strong> Chomedey, Laval-des-Rapides and Pont Viau neighbourhoods.On <strong>the</strong> North and South Shores, where <strong>the</strong> population density is lower than in <strong>the</strong> o<strong>the</strong>r three sectors <strong>of</strong> <strong>Greater</strong> Montréal,<strong>the</strong>re are none<strong>the</strong>less some zones where <strong>the</strong> population density is a bit higher. On <strong>the</strong> North Shore, most <strong>of</strong> <strong>the</strong> populationis concentrated in zones near <strong>the</strong> Rivière des Prairies, while on <strong>the</strong> South Shore, it is concentrated mainly in zones near <strong>the</strong>St. Lawrence River or in <strong>the</strong> axis <strong>of</strong> highways 112 and 116.Population density (inhab./km²) by<strong>Greater</strong> Montréal census tract, 200630Source: Statistics Canada, Census <strong>of</strong> Population 2006. Calculations by <strong>the</strong> CMM, <strong>2010</strong>.
4.3 Housing constructionMarked increase in housing startsthroughout <strong>the</strong> area since <strong>the</strong> late 1990sWith <strong>the</strong> rebound in economic and demographic growthat <strong>the</strong> end <strong>of</strong> <strong>the</strong> 1990s, <strong>Greater</strong> Montréal saw a markedincrease in housing starts in each <strong>of</strong> its five geographicsectors. The number <strong>of</strong> housing starts peaked in 2004,however, and since <strong>the</strong>n has been declining, in particularin <strong>the</strong> Montréal agglomeration and on <strong>the</strong> North Shore. In2009, despite <strong>the</strong> renewed economic slowdown, <strong>the</strong> number<strong>of</strong> housing starts in <strong>the</strong> area remained considerably higherthan in <strong>the</strong> 1990s.Between 2002 and 2009, residential construction wasparticularly healthy, as just over 175,000 new housing unitswere built in <strong>the</strong> area. The highest proportion <strong>of</strong> <strong>the</strong>sehousing units (33%) went up in <strong>the</strong> Montréal agglomeration.One-quarter (25%) <strong>of</strong> all new homes were built on <strong>the</strong>North Shore, 19% on <strong>the</strong> South Shore, 13% in Laval and10% in <strong>the</strong> Longueuil agglomeration.Trends in housing starts (nbr), <strong>Greater</strong> Montréalsectors, 1991-200912,00010,0008,0006,0004,0002,00001991 1992 1993 1994 1995 1996 1997 1998 1999 2000 2001 2002 2003 2004 2005 2006 2007 2008 2009Montréal agglomerationLavalNorth ShoreLongueuil agglomerationSouth ShoreSource: Canada Mortgage and Housing Corporation, special compilation basedon <strong>the</strong> Starts and Completions Survey, 1991 to <strong>2010</strong>.Calculations by <strong>the</strong> CMM, <strong>2010</strong>.land useMarket share <strong>of</strong> housing starts in <strong>Greater</strong> Montréal (%) by municipality, 2002-2009Market share <strong>of</strong> housing starts in <strong>Greater</strong>Montréal (%) by geographic sector,2002-200931Geographic sectors Housing starts Market shareMontreal agglomeration 57,420 32.5%Longueuil agglomeration 17,863 10.1%Laval 23,579 13.4%North Shore 44,139 25.0%South Shore 33,617 19.0%<strong>Greater</strong> Montréal 176,618 100.0%Source: Canada Mortgage and Housing Corporation, special compilation based on <strong>the</strong> Starts and Completions Survey, 2002 to <strong>2010</strong>. Calculations by <strong>the</strong> CMM, <strong>2010</strong>.