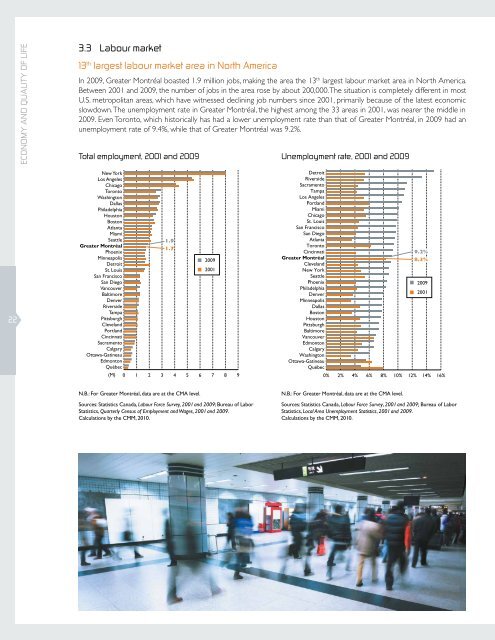
ECONOMY AND QUALITY OF LIFe3.3 Labour market13 th largest labour market area in North AmericaIn 2009, <strong>Greater</strong> Montréal boasted 1.9 million jobs, making <strong>the</strong> area <strong>the</strong> 13 th largest labour market area in North America.Between 2001 and 2009, <strong>the</strong> number <strong>of</strong> jobs in <strong>the</strong> area rose by about 200,000. The situation is completely different in mostU.S. metropolitan areas, which have witnessed declining job numbers since 2001, primarily because <strong>of</strong> <strong>the</strong> latest economicslowdown. The unemployment rate in <strong>Greater</strong> Montréal, <strong>the</strong> highest among <strong>the</strong> 33 areas in 2001, was nearer <strong>the</strong> middle in2009. Even Toronto, which historically has had a lower unemployment rate than that <strong>of</strong> <strong>Greater</strong> Montréal, in 2009 had anunemployment rate <strong>of</strong> 9.4%, while that <strong>of</strong> <strong>Greater</strong> Montréal was 9.2%.Total employment, 2001 and 2009Unemployment rate, 2001 and 200922New YorkLos AngelesChicagoTorontoWashingtonDallasPhiladelphiaHoustonBostonAtlantaMiamiSeattle<strong>Greater</strong> MontréalPhoenix1.91.7MinneapolisDetroitSt. Louis20092001San FranciscoSan DiegoVancouverBaltimoreDenverRiversideTampaPittsburghClevelandPortlandCincinnatiSacramentoCalgaryOttawa-GatineauEdmontonQuébec(M) 0 1 2 3 4 5 6 7 8 9DetroitRiversideSacramentoTampaLos AngelesPortlandMiamiChicagoSt. LouisSan FranciscoSan DiegoAtlantaTorontoCincinnati<strong>Greater</strong> MontréalCleveland9.2%8.3%New YorkSeattlePhoenixPhiladelphiaDenver20092001MinneapolisDallasBostonHoustonPittsburghBaltimoreVancouverEdmontonCalgaryWashingtonOttawa-GatineauQuébec0% 2% 4% 6% 8% 10% 12% 14% 16%N.B.: For <strong>Greater</strong> Montréal, data are at <strong>the</strong> CMA level.Sources: Statistics Canada, Labour Force Survey, 2001 and 2009; Bureau <strong>of</strong> LaborStatistics, Quarterly Census <strong>of</strong> Employment and Wages, 2001 and 2009.Calculations by <strong>the</strong> CMM, <strong>2010</strong>.N.B.: For <strong>Greater</strong> Montréal, data are at <strong>the</strong> CMA level.Sources: Statistics Canada, Labour Force Survey, 2001 and 2009; Bureau <strong>of</strong> LaborStatistics, Local Area Unemployment Statistics, 2001 and 2009.Calculations by <strong>the</strong> CMM, <strong>2010</strong>.
A diversified economy that has embraced high technologyOver <strong>the</strong> past 20 years, <strong>Greater</strong> Montréal has gone from a manufacturing economy to a more diversified economy based moreon services and knowledge. This transition can be seen primarily in <strong>the</strong> considerable job growth in pr<strong>of</strong>essional, scientific andtechnical services, information, culture and recreation sector, and business services. At <strong>the</strong> same time, jobs in manufacturinghave dropped sharply in 20 years, from 21% <strong>of</strong> total employment in 1989 to 13% in 2009.More specifically, jobs in high technology, including production (e.g.: pharmaceutical products or computer supplies) andservices (e.g.: telecommunication or scientific R&D services), represented 8% <strong>of</strong> jobs in <strong>the</strong> area in 2009, making <strong>Greater</strong>Montréal one <strong>of</strong> North America’s metropolitan areas with <strong>the</strong> greatest percentage <strong>of</strong> jobs in high-technology industries.Percentage <strong>of</strong> jobs by industry sector, <strong>Greater</strong>Montréal, 1989 and 2009Employment distribution in all high-technologyindustries, 5 2009ECONOMY AND QUALITY OF LIFeTradeManufacturingHealth Careand Social AssistancePr<strong>of</strong>essional, Scientificand Technical ServicesEducational ServicesFinance, Insurance,Real Estate and LeasingInformation, Cultureand RecreationAccommodationand Food ServicesTransportation and WarehousingConstructionO<strong>the</strong>r ServicesPublic AdministrationBusiness, Buildingand O<strong>the</strong>r Support ServicesUtilitiesAgricultureForestry, Fishing, Mining,Oil and Gas4.9%7.2%5.9%6.6%6.8%5.8%4.0%5.7%4.7%4.9%6.6%4.5%5.3%4.5%4.6%4.4%4.8%4.0%2.6%0.9%0.9%0.2%0.5%0.1%0.3%13.2%11.8%9.5%9.5%16.6%17.1%2009198921.4%0% 5% 10% 15% 20% 25%SeattleWashingtonSan DiegoSan FranciscoOttawa-GatineauBoston<strong>Greater</strong> Montréal7.9%CalgaryTorontoLos AngelesDallasMinneapolisVancouverDetroitBaltimoreSt. LouisAtlantaSacramentoNew YorkPortlandCincinnatiDenverPittsburghPhiladelphiaPhoenixChicagoMiamiTampaClevelandHoustonRiverside0% 2% 4% 6% 8% 10% 12% 14%23N.B.: For <strong>Greater</strong> Montréal, data are at <strong>the</strong> CMA level.Source: Statistics Canada, Labour Force Survey, 1989 and 2009.Calculations by <strong>the</strong> CMM, <strong>2010</strong>.N.B.: For <strong>Greater</strong> Montréal, data are at <strong>the</strong> CMA level.Sources: Statistics Canada, Labour Force Survey, 2009; US Census Bureau, QuarterlyCensus <strong>of</strong> Employment and Wages, 2009. Calculations by <strong>the</strong> CMM, <strong>2010</strong>.5 The high-tech industries in question are <strong>the</strong> 14 North American Industry Classification System (NAICS) sectors identified by Daniel E. Hecker <strong>of</strong> <strong>the</strong> U.S. Bureau <strong>of</strong>Labor Statistics, and include <strong>the</strong> highest percentages <strong>of</strong> scientists, engineers and specialized technicians:3254- Pharmaceutical and Medicine Manufacturing3341- Computer and Peripheral Equipment Manufacturing3342- Communications Equipment Manufacturing3344- Semiconductor and O<strong>the</strong>r Electronic Component Manufacturing3345- Navigational, Measuring, Electromedical, and Control Instruments Manufacturing3364- Aerospace Product and Parts Manufacturing5112- S<strong>of</strong>tware Publishers5161- Internet Publishing and Broadcasting5179- O<strong>the</strong>r Telecommunications5181- Internet Service Providers and Web Search Portals5182- Data Processing, Hosting, and Related Services5413- Architectural, Engineering, and Related Services5415- Computer Systems Design and Related Services5417- Scientific Research and Development ServicesReference: D. E. Hecker, “High-technology employment: a NAICS-based update.” Bureau <strong>of</strong> Labor Statistics, Monthly Labor Review, July 2005.