

Uranium ore-forming systems of the - Geoscience Australia
Uranium ore-forming systems of the - Geoscience Australia
Uranium ore-forming systems of the - Geoscience Australia

Create successful ePaper yourself
Turn your PDF publications into a flip-book with our unique Google optimized e-Paper software.
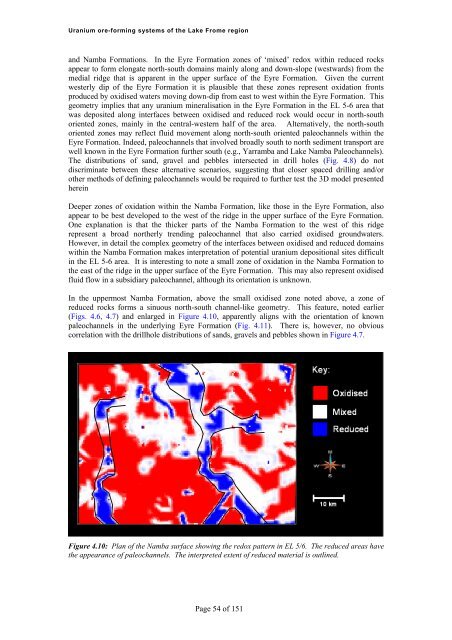
<strong>Uranium</strong> <strong>ore</strong>-<strong>forming</strong> <strong>systems</strong> <strong>of</strong> <strong>the</strong> Lake Frome regionand Namba Formations. In <strong>the</strong> Eyre Formation zones <strong>of</strong> ‘mixed’ redox within reduced rocksappear to form elongate north-south domains mainly along and down-slope (westwards) from <strong>the</strong>medial ridge that is apparent in <strong>the</strong> upper surface <strong>of</strong> <strong>the</strong> Eyre Formation. Given <strong>the</strong> currentwesterly dip <strong>of</strong> <strong>the</strong> Eyre Formation it is plausible that <strong>the</strong>se zones represent oxidation frontsproduced by oxidised waters moving down-dip from east to west within <strong>the</strong> Eyre Formation. Thisgeometry implies that any uranium mineralisation in <strong>the</strong> Eyre Formation in <strong>the</strong> EL 5-6 area thatwas deposited along interfaces between oxidised and reduced rock would occur in north-southoriented zones, mainly in <strong>the</strong> central-western half <strong>of</strong> <strong>the</strong> area. Alternatively, <strong>the</strong> north-southoriented zones may reflect fluid movement along north-south oriented paleochannels within <strong>the</strong>Eyre Formation. Indeed, paleochannels that involved broadly south to north sediment transport arewell known in <strong>the</strong> Eyre Formation fur<strong>the</strong>r south (e.g., Yarramba and Lake Namba Paleochannels).The distributions <strong>of</strong> sand, gravel and pebbles intersected in drill holes (Fig. 4.8) do notdiscriminate between <strong>the</strong>se alternative scenarios, suggesting that closer spaced drilling and/oro<strong>the</strong>r methods <strong>of</strong> defining paleochannels would be required to fur<strong>the</strong>r test <strong>the</strong> 3D model presentedhereinDeeper zones <strong>of</strong> oxidation within <strong>the</strong> Namba Formation, like those in <strong>the</strong> Eyre Formation, alsoappear to be best developed to <strong>the</strong> west <strong>of</strong> <strong>the</strong> ridge in <strong>the</strong> upper surface <strong>of</strong> <strong>the</strong> Eyre Formation.One explanation is that <strong>the</strong> thicker parts <strong>of</strong> <strong>the</strong> Namba Formation to <strong>the</strong> west <strong>of</strong> this ridgerepresent a broad nor<strong>the</strong>rly trending paleochannel that also carried oxidised groundwaters.However, in detail <strong>the</strong> complex geometry <strong>of</strong> <strong>the</strong> interfaces between oxidised and reduced domainswithin <strong>the</strong> Namba Formation makes interpretation <strong>of</strong> potential uranium depositional sites difficultin <strong>the</strong> EL 5-6 area. It is interesting to note a small zone <strong>of</strong> oxidation in <strong>the</strong> Namba Formation to<strong>the</strong> east <strong>of</strong> <strong>the</strong> ridge in <strong>the</strong> upper surface <strong>of</strong> <strong>the</strong> Eyre Formation. This may also represent oxidisedfluid flow in a subsidiary paleochannel, although its orientation is unknown.In <strong>the</strong> uppermost Namba Formation, above <strong>the</strong> small oxidised zone noted above, a zone <strong>of</strong>reduced rocks forms a sinuous north-south channel-like geometry. This feature, noted earlier(Figs. 4.6, 4.7) and enlarged in Figure 4.10, apparently aligns with <strong>the</strong> orientation <strong>of</strong> knownpaleochannels in <strong>the</strong> underlying Eyre Formation (Fig. 4.11). There is, however, no obviouscorrelation with <strong>the</strong> drillhole distributions <strong>of</strong> sands, gravels and pebbles shown in Figure 4.7.Figure 4.10: Plan <strong>of</strong> <strong>the</strong> Namba surface showing <strong>the</strong> redox pattern in EL 5/6. The reduced areas have<strong>the</strong> appearance <strong>of</strong> paleochannels. The interpreted extent <strong>of</strong> reduced material is outlined.Page 54 <strong>of</strong> 151


