Sam Ziemann From - Region of Waterloo
Sam Ziemann From - Region of Waterloo
Sam Ziemann From - Region of Waterloo
You also want an ePaper? Increase the reach of your titles
YUMPU automatically turns print PDFs into web optimized ePapers that Google loves.
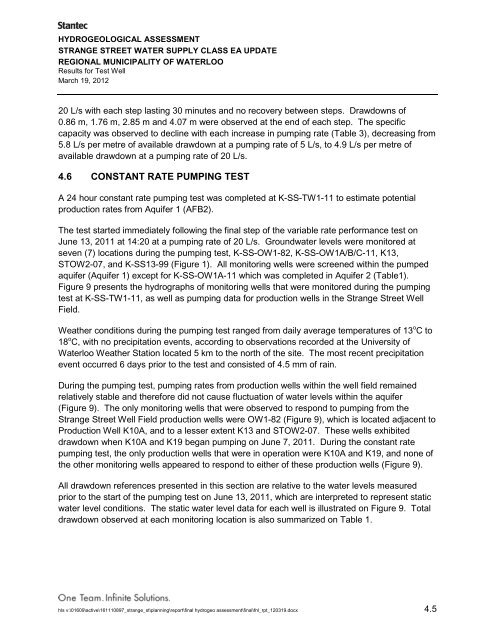
HYDROGEOLOGICAL ASSESSMENTSTRANGE STREET WATER SUPPLY CLASS EA UPDATEREGIONAL MUNICIPALITY OF WATERLOOResults for Test WellMarch 19, 201220 L/s with each step lasting 30 minutes and no recovery between steps. Drawdowns <strong>of</strong>0.86 m, 1.76 m, 2.85 m and 4.07 m were observed at the end <strong>of</strong> each step. The specificcapacity was observed to decline with each increase in pumping rate (Table 3), decreasing from5.8 L/s per metre <strong>of</strong> available drawdown at a pumping rate <strong>of</strong> 5 L/s, to 4.9 L/s per metre <strong>of</strong>available drawdown at a pumping rate <strong>of</strong> 20 L/s.4.6 CONSTANT RATE PUMPING TESTA 24 hour constant rate pumping test was completed at K-SS-TW1-11 to estimate potentialproduction rates from Aquifer 1 (AFB2).The test started immediately following the final step <strong>of</strong> the variable rate performance test onJune 13, 2011 at 14:20 at a pumping rate <strong>of</strong> 20 L/s. Groundwater levels were monitored atseven (7) locations during the pumping test, K-SS-OW1-82, K-SS-OW1A/B/C-11, K13,STOW2-07, and K-SS13-99 (Figure 1). All monitoring wells were screened within the pumpedaquifer (Aquifer 1) except for K-SS-OW1A-11 which was completed in Aquifer 2 (Table1).Figure 9 presents the hydrographs <strong>of</strong> monitoring wells that were monitored during the pumpingtest at K-SS-TW1-11, as well as pumping data for production wells in the Strange Street WellField.Weather conditions during the pumping test ranged from daily average temperatures <strong>of</strong> 13 o C to18 o C, with no precipitation events, according to observations recorded at the University <strong>of</strong><strong>Waterloo</strong> Weather Station located 5 km to the north <strong>of</strong> the site. The most recent precipitationevent occurred 6 days prior to the test and consisted <strong>of</strong> 4.5 mm <strong>of</strong> rain.During the pumping test, pumping rates from production wells within the well field remainedrelatively stable and therefore did not cause fluctuation <strong>of</strong> water levels within the aquifer(Figure 9). The only monitoring wells that were observed to respond to pumping from theStrange Street Well Field production wells were OW1-82 (Figure 9), which is located adjacent toProduction Well K10A, and to a lesser extent K13 and STOW2-07. These wells exhibiteddrawdown when K10A and K19 began pumping on June 7, 2011. During the constant ratepumping test, the only production wells that were in operation were K10A and K19, and none <strong>of</strong>the other monitoring wells appeared to respond to either <strong>of</strong> these production wells (Figure 9).All drawdown references presented in this section are relative to the water levels measuredprior to the start <strong>of</strong> the pumping test on June 13, 2011, which are interpreted to represent staticwater level conditions. The static water level data for each well is illustrated on Figure 9. Totaldrawdown observed at each monitoring location is also summarized on Table 1.hls v:\01609\active\161110897_strange_st\planning\report\final hydrogeo assessment\final\fnl_rpt_120319.docx 4.5


