Sam Ziemann From - Region of Waterloo
Sam Ziemann From - Region of Waterloo
Sam Ziemann From - Region of Waterloo
You also want an ePaper? Increase the reach of your titles
YUMPU automatically turns print PDFs into web optimized ePapers that Google loves.
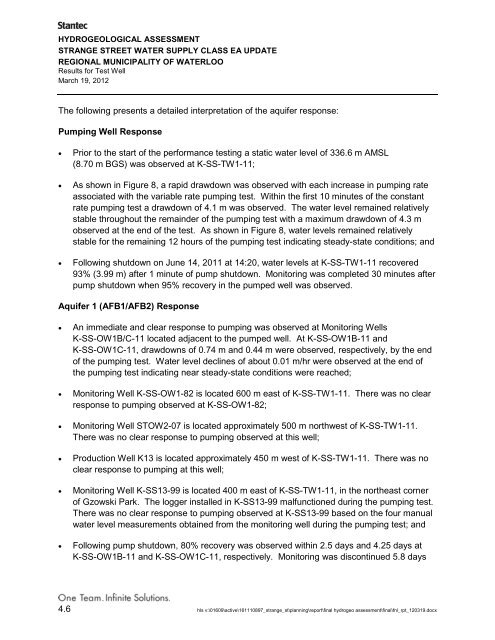
HYDROGEOLOGICAL ASSESSMENTSTRANGE STREET WATER SUPPLY CLASS EA UPDATEREGIONAL MUNICIPALITY OF WATERLOOResults for Test WellMarch 19, 2012The following presents a detailed interpretation <strong>of</strong> the aquifer response:Pumping Well Response• Prior to the start <strong>of</strong> the performance testing a static water level <strong>of</strong> 336.6 m AMSL(8.70 m BGS) was observed at K-SS-TW1-11;• As shown in Figure 8, a rapid drawdown was observed with each increase in pumping rateassociated with the variable rate pumping test. Within the first 10 minutes <strong>of</strong> the constantrate pumping test a drawdown <strong>of</strong> 4.1 m was observed. The water level remained relativelystable throughout the remainder <strong>of</strong> the pumping test with a maximum drawdown <strong>of</strong> 4.3 mobserved at the end <strong>of</strong> the test. As shown in Figure 8, water levels remained relativelystable for the remaining 12 hours <strong>of</strong> the pumping test indicating steady-state conditions; and• Following shutdown on June 14, 2011 at 14:20, water levels at K-SS-TW1-11 recovered93% (3.99 m) after 1 minute <strong>of</strong> pump shutdown. Monitoring was completed 30 minutes afterpump shutdown when 95% recovery in the pumped well was observed.Aquifer 1 (AFB1/AFB2) Response• An immediate and clear response to pumping was observed at Monitoring WellsK-SS-OW1B/C-11 located adjacent to the pumped well. At K-SS-OW1B-11 andK-SS-OW1C-11, drawdowns <strong>of</strong> 0.74 m and 0.44 m were observed, respectively, by the end<strong>of</strong> the pumping test. Water level declines <strong>of</strong> about 0.01 m/hr were observed at the end <strong>of</strong>the pumping test indicating near steady-state conditions were reached;• Monitoring Well K-SS-OW1-82 is located 600 m east <strong>of</strong> K-SS-TW1-11. There was no clearresponse to pumping observed at K-SS-OW1-82;• Monitoring Well STOW2-07 is located approximately 500 m northwest <strong>of</strong> K-SS-TW1-11.There was no clear response to pumping observed at this well;• Production Well K13 is located approximately 450 m west <strong>of</strong> K-SS-TW1-11. There was noclear response to pumping at this well;• Monitoring Well K-SS13-99 is located 400 m east <strong>of</strong> K-SS-TW1-11, in the northeast corner<strong>of</strong> Gzowski Park. The logger installed in K-SS13-99 malfunctioned during the pumping test.There was no clear response to pumping observed at K-SS13-99 based on the four manualwater level measurements obtained from the monitoring well during the pumping test; and• Following pump shutdown, 80% recovery was observed within 2.5 days and 4.25 days atK-SS-OW1B-11 and K-SS-OW1C-11, respectively. Monitoring was discontinued 5.8 days4.6 hls v:\01609\active\161110897_strange_st\planning\report\final hydrogeo assessment\final\fnl_rpt_120319.docx


