Sam Ziemann From - Region of Waterloo
Sam Ziemann From - Region of Waterloo
Sam Ziemann From - Region of Waterloo
You also want an ePaper? Increase the reach of your titles
YUMPU automatically turns print PDFs into web optimized ePapers that Google loves.
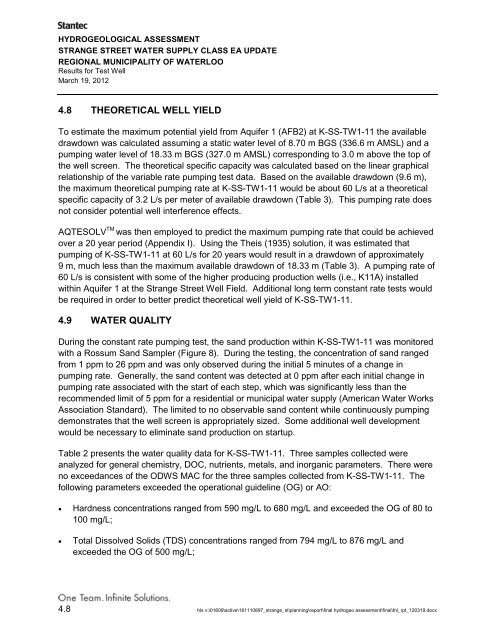
HYDROGEOLOGICAL ASSESSMENTSTRANGE STREET WATER SUPPLY CLASS EA UPDATEREGIONAL MUNICIPALITY OF WATERLOOResults for Test WellMarch 19, 20124.8 THEORETICAL WELL YIELDTo estimate the maximum potential yield from Aquifer 1 (AFB2) at K-SS-TW1-11 the availabledrawdown was calculated assuming a static water level <strong>of</strong> 8.70 m BGS (336.6 m AMSL) and apumping water level <strong>of</strong> 18.33 m BGS (327.0 m AMSL) corresponding to 3.0 m above the top <strong>of</strong>the well screen. The theoretical specific capacity was calculated based on the linear graphicalrelationship <strong>of</strong> the variable rate pumping test data. Based on the available drawdown (9.6 m),the maximum theoretical pumping rate at K-SS-TW1-11 would be about 60 L/s at a theoreticalspecific capacity <strong>of</strong> 3.2 L/s per meter <strong>of</strong> available drawdown (Table 3). This pumping rate doesnot consider potential well interference effects.AQTESOLV TM was then employed to predict the maximum pumping rate that could be achievedover a 20 year period (Appendix I). Using the Theis (1935) solution, it was estimated thatpumping <strong>of</strong> K-SS-TW1-11 at 60 L/s for 20 years would result in a drawdown <strong>of</strong> approximately9 m, much less than the maximum available drawdown <strong>of</strong> 18.33 m (Table 3). A pumping rate <strong>of</strong>60 L/s is consistent with some <strong>of</strong> the higher producing production wells (i.e., K11A) installedwithin Aquifer 1 at the Strange Street Well Field. Additional long term constant rate tests wouldbe required in order to better predict theoretical well yield <strong>of</strong> K-SS-TW1-11.4.9 WATER QUALITYDuring the constant rate pumping test, the sand production within K-SS-TW1-11 was monitoredwith a Rossum Sand <strong>Sam</strong>pler (Figure 8). During the testing, the concentration <strong>of</strong> sand rangedfrom 1 ppm to 26 ppm and was only observed during the initial 5 minutes <strong>of</strong> a change inpumping rate. Generally, the sand content was detected at 0 ppm after each initial change inpumping rate associated with the start <strong>of</strong> each step, which was significantly less than therecommended limit <strong>of</strong> 5 ppm for a residential or municipal water supply (American Water WorksAssociation Standard). The limited to no observable sand content while continuously pumpingdemonstrates that the well screen is appropriately sized. Some additional well developmentwould be necessary to eliminate sand production on startup.Table 2 presents the water quality data for K-SS-TW1-11. Three samples collected wereanalyzed for general chemistry, DOC, nutrients, metals, and inorganic parameters. There wereno exceedances <strong>of</strong> the ODWS MAC for the three samples collected from K-SS-TW1-11. Thefollowing parameters exceeded the operational guideline (OG) or AO:• Hardness concentrations ranged from 590 mg/L to 680 mg/L and exceeded the OG <strong>of</strong> 80 to100 mg/L;• Total Dissolved Solids (TDS) concentrations ranged from 794 mg/L to 876 mg/L andexceeded the OG <strong>of</strong> 500 mg/L;4.8 hls v:\01609\active\161110897_strange_st\planning\report\final hydrogeo assessment\final\fnl_rpt_120319.docx


