5 The role of quorum-sensing in the virulence of Pseudomonas ...
5 The role of quorum-sensing in the virulence of Pseudomonas ...
5 The role of quorum-sensing in the virulence of Pseudomonas ...

You also want an ePaper? Increase the reach of your titles
YUMPU automatically turns print PDFs into web optimized ePapers that Google loves.
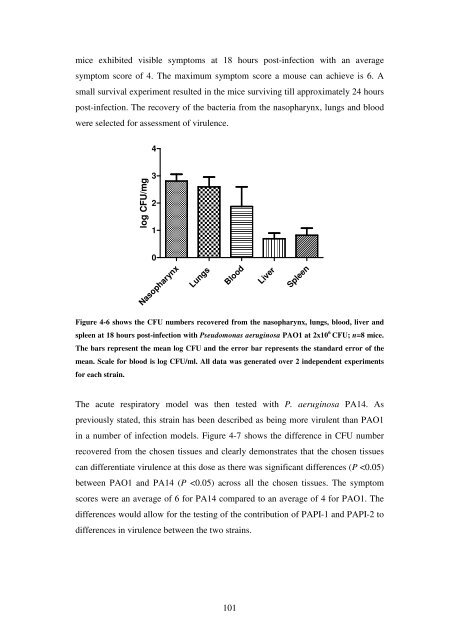
mice exhibited visible symptoms at 18 hours post-<strong>in</strong>fection with an average<br />
symptom score <strong>of</strong> 4. <strong>The</strong> maximum symptom score a mouse can achieve is 6. A<br />
small survival experiment resulted <strong>in</strong> <strong>the</strong> mice surviv<strong>in</strong>g till approximately 24 hours<br />
post-<strong>in</strong>fection. <strong>The</strong> recovery <strong>of</strong> <strong>the</strong> bacteria from <strong>the</strong> nasopharynx, lungs and blood<br />
were selected for assessment <strong>of</strong> <strong>virulence</strong>.<br />
log CFU/mg<br />
4<br />
3<br />
2<br />
1<br />
0<br />
Nasopharynx<br />
Lungs<br />
Blood<br />
101<br />
Liver<br />
Spleen<br />
Figure 4-6 shows <strong>the</strong> CFU numbers recovered from <strong>the</strong> nasopharynx, lungs, blood, liver and<br />
spleen at 18 hours post-<strong>in</strong>fection with <strong>Pseudomonas</strong> aerug<strong>in</strong>osa PAO1 at 2x10 6 CFU; n=8 mice.<br />
<strong>The</strong> bars represent <strong>the</strong> mean log CFU and <strong>the</strong> error bar represents <strong>the</strong> standard error <strong>of</strong> <strong>the</strong><br />
mean. Scale for blood is log CFU/ml. All data was generated over 2 <strong>in</strong>dependent experiments<br />
for each stra<strong>in</strong>.<br />
<strong>The</strong> acute respiratory model was <strong>the</strong>n tested with P. aerug<strong>in</strong>osa PA14. As<br />
previously stated, this stra<strong>in</strong> has been described as be<strong>in</strong>g more virulent than PAO1<br />
<strong>in</strong> a number <strong>of</strong> <strong>in</strong>fection models. Figure 4-7 shows <strong>the</strong> difference <strong>in</strong> CFU number<br />
recovered from <strong>the</strong> chosen tissues and clearly demonstrates that <strong>the</strong> chosen tissues<br />
can differentiate <strong>virulence</strong> at this dose as <strong>the</strong>re was significant differences (P