Education and Training in Ethiopia An Evaluation of Approaching EFA Goals
Education and Training in Ethiopia - Koulutuksen tutkimuslaitos
Education and Training in Ethiopia - Koulutuksen tutkimuslaitos
- No tags were found...

You also want an ePaper? Increase the reach of your titles
YUMPU automatically turns print PDFs into web optimized ePapers that Google loves.
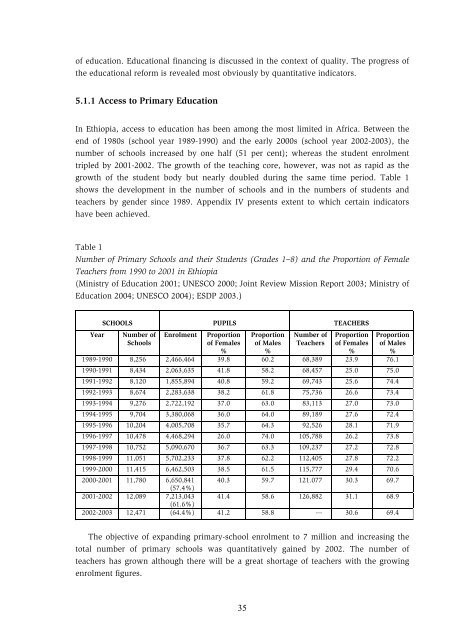
<strong>of</strong> education. <strong>Education</strong>al f<strong>in</strong>anc<strong>in</strong>g is discussed <strong>in</strong> the context <strong>of</strong> quality. The progress <strong>of</strong>the educational reform is revealed most obviously by quantitative <strong>in</strong>dicators.5.1.1 Access to Primary <strong>Education</strong>In <strong>Ethiopia</strong>, access to education has been among the most limited <strong>in</strong> Africa. Between theend <strong>of</strong> 1980s (school year 1989-1990) <strong>and</strong> the early 2000s (school year 2002-2003), thenumber <strong>of</strong> schools <strong>in</strong>creased by one half (51 per cent); whereas the student enrolmenttripled by 2001-2002. The growth <strong>of</strong> the teach<strong>in</strong>g core, however, was not as rapid as thegrowth <strong>of</strong> the student body but nearly doubled dur<strong>in</strong>g the same time period. Table 1shows the development <strong>in</strong> the number <strong>of</strong> schools <strong>and</strong> <strong>in</strong> the numbers <strong>of</strong> students <strong>and</strong>teachers by gender s<strong>in</strong>ce 1989. Appendix IV presents extent to which certa<strong>in</strong> <strong>in</strong>dicatorshave been achieved.Table 1Number <strong>of</strong> Primary Schools <strong>and</strong> their Students (Grades 1–8) <strong>and</strong> the Proportion <strong>of</strong> FemaleTeachers from 1990 to 2001 <strong>in</strong> <strong>Ethiopia</strong>(M<strong>in</strong>istry <strong>of</strong> <strong>Education</strong> 2001; UNESCO 2000; Jo<strong>in</strong>t Review Mission Report 2003; M<strong>in</strong>istry <strong>of</strong><strong>Education</strong> 2004; UNESCO 2004); ESDP 2003.)SCHOOLS PUPILS TEACHERSYear Number <strong>of</strong>SchoolsEnrolment Proportion<strong>of</strong> Females%Proportion<strong>of</strong> Males%Number <strong>of</strong>TeachersProportion<strong>of</strong> Females%Proportion<strong>of</strong> Males%1989-1990 8,256 2,466,464 39.8 60.2 68,389 23.9 76.11990-1991 8,434 2,063,635 41.8 58.2 68,457 25.0 75.01991-1992 8,120 1,855,894 40.8 59.2 69,743 25.6 74.41992-1993 8,674 2,283,638 38.2 61.8 75,736 26.6 73.41993-1994 9,276 2,722,192 37.0 63.0 83,113 27.0 73.01994-1995 9,704 3,380,068 36.0 64.0 89,189 27.6 72.41995-1996 10,204 4,005,708 35.7 64.3 92,526 28.1 71.91996-1997 10,478 4,468,294 26.0 74.0 105,788 26.2 73.81997-1998 10,752 5,090,670 36.7 63.3 109,237 27.2 72.81998-1999 11,051 5,702,233 37.8 62.2 112,405 27.8 72.21999-2000 11,415 6,462,503 38.5 61.5 115,777 29.4 70.62000-2001 11,780 6,650,841 40.3 59.7 121.077 30.3 69.7(57.4%)2001-2002 12,089 7,213,043 41.4 58.6 126,882 31.1 68.9(61.6%)2002-2003 12,471 (64.4%) 41.2 58.8 --- 30.6 69.4The objective <strong>of</strong> exp<strong>and</strong><strong>in</strong>g primary-school enrolment to 7 million <strong>and</strong> <strong>in</strong>creas<strong>in</strong>g thetotal number <strong>of</strong> primary schools was quantitatively ga<strong>in</strong>ed by 2002. The number <strong>of</strong>teachers has grown although there will be a great shortage <strong>of</strong> teachers with the grow<strong>in</strong>genrolment figures.35

![to read the full report [pdf, Amharic] - Ethiopian Review](https://img.yumpu.com/52737829/1/190x245/to-read-the-full-report-pdf-amharic-ethiopian-review.jpg?quality=85)