APPENDIX IVNational Indicators <strong>of</strong> <strong>Education</strong> Key Performance <strong>in</strong> 1995-2003 <strong>in</strong> <strong>Ethiopia</strong>BUDGET ANDEXPENDITURE1995/96 1998/99 1999/00 2000/01 2001/02 2002/03GOALS2004/051Proportion <strong>of</strong> education <strong>in</strong>total budgets/expenditures13.7% 11.9% 10.5% 13.7% 19.0% 17.0% 19.0%2 Proportion <strong>of</strong> primary 46.7% 51. 0% - 50.1% 65.0% - -education <strong>in</strong> total educationbudgetAccess3 Total no <strong>of</strong> primary9,670 11,051 11,490 11,780 12,089 12,471schools4 Total primary (Grade 1–8) 3,787,919 5,702,233 6,462,503 6,650,841 7,000,000 - -enrolments5 GER Primary 1–8 30.1% 45.8% 51.0% 57.4% 50.0% 64.4% 70%Quality6 Proportion <strong>of</strong> lower85.0%t 91.3% 89.6%t 96.6% 95.0% 97.1% 99.0%primary (Grade 1–4)teachers qualified7 Total no <strong>of</strong> upper primary 27,381 - 39,145 43,526 36,777 - -(Grade 5–8) teachers8 Number (no) <strong>of</strong> qualified 5,729 - 7,205 10,400 20,000 28.7% 80.0%upper primary teachers9 Total no <strong>of</strong> secondary 12,143 13,078 13,154 14,029 17,463 - -teachers10 No <strong>of</strong> qualified secondary 4,910 5,054 4,858 5,127 10,760 39.0% 73.2 %teachers11 No <strong>of</strong> core primary 2,273,000 - 13,643,000 20,160,150 51,000,000 - -textbooks <strong>in</strong> schools12 Grade 8 exam pass rate 61.7% - 82.4% - 80.0% - -13 Grade 4 sampleassessment <strong>of</strong> learn<strong>in</strong>g- 48.1% - - -- -achievement14 Student textbook ratio – 5:1 - - 3:1 1:1 2.5:1 1:1primary core text BooksEfficiency15 Primary-school student: 53 63 66.4 70 50 73 60section ratio16 Secondary-school student: 63 71 74.9 78 50 77 60section ratio17 Grade 1 dropout 28.5% 27.0% 30.3% 27.9% 14.2% 28.7% 14.2%18 Total primary-school8.5% 12.0% 18.9% 17.8% 4.2% 17.1% 8.9%dropout19 Average Grades 4–812.8% 12.1% 12.9% 10.3% 6.4% 11.0% 6.4%repetition rate20 Average Grades 4–816.2% - 9.5% 13.4% 8.1% 14.1% 8.1%repetition rate for girls21 Coefficient <strong>of</strong> primaryschool49.6% 39.8% 36.6% 31.8% 80.0% 39.1% 50.0%efficiencyEquity22 Gross primary-school 7.6%/ 7.8% 8.5% 10.8% 25.0% 14.8% 20.0%enrolment rate <strong>in</strong> the twomost underserved areas16.2%23 Proportion <strong>of</strong> girls <strong>in</strong>primary-school enrolment(Grades 1–8)38.0% 37.8% 39.2% 40.6% 45.0% 41.2% 43.3%(FDRE & UNICEF, 2001; M<strong>in</strong>istry <strong>of</strong> <strong>Education</strong>, 1996; 1997; 1999a; 1999b; 2001; ESDP, 2003; M<strong>in</strong>istry <strong>of</strong> <strong>Education</strong>, 2004)71
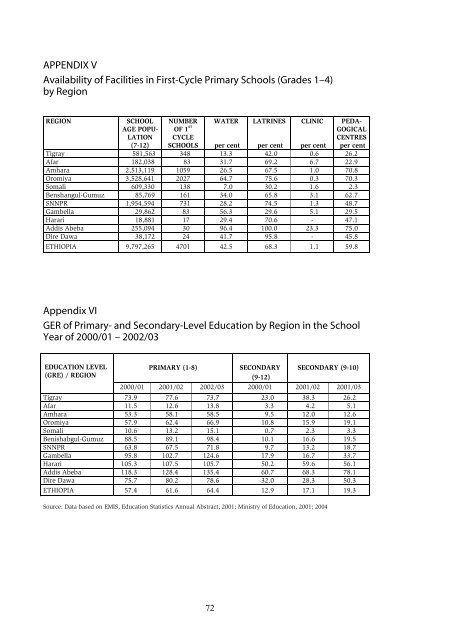
APPENDIX VAvailability <strong>of</strong> Facilities <strong>in</strong> First-Cycle Primary Schools (Grades 1–4)by RegionREGIONSCHOOLAGE POPU-LATION(7-12)NUMBEROF 1 STCYCLESCHOOLSWATERLATRINESCLINICPEDA-GOGICALCENTRESper centper cent per cent per centTigray 581,563 348 13.3 42.0 0.6 26.2Afar 182,038 83 31.7 69.2 6.7 22.9Amhara 2,513,119 1059 26.5 67.5 1.0 70.8Oromiya 3,528,641 2027 64.7 75.6 0.3 70.3Somali 609,330 138 7.0 30.2 1.6 2.3Benshangul-Gumuz 85,769 161 34.0 65.8 3.1 62.7SNNPR 1,954,594 731 28.2 74.5 1.3 48.7Gambella 29,862 83 56.3 29.6 5.1 29.5Harari 18,881 17 29.4 70.6 - 47.1Addis Abeba 255,094 30 96.4 100.0 23.3 75.0Dire Dawa 38,172 24 41.7 95.8 - 45.8ETHIOPIA 9,797,265 4701 42.5 68.3 1.1 59.8Appendix VIGER <strong>of</strong> Primary- <strong>and</strong> Secondary-Level <strong>Education</strong> by Region <strong>in</strong> the SchoolYear <strong>of</strong> 2000/01 – 2002/03EDUCATION LEVEL(GRE) / REGIONPRIMARY (1-8)SECONDARY(9-12)SECONDARY (9-10)2000/01 2001/02 2002/03 2000/01 2001/02 2001/03Tigray 73.9 77.6 73.7 23.0 38.3 26.2Afar 11.5 12.6 13.8 3.3 4.2 5.1Amhara 53.3 58.1 58.5 9.5 12.0 12.6Oromiya 57.9 62.4 66.9 10.8 15.9 19.1Somali 10.6 13.2 15.1 0.7 2.3 3.3Benishabgul-Gumuz 88.5 89.1 98.4 10.1 16.6 19.5SNNPR 63.8 67.5 71.8 9.7 13.2 18.7Gambella 95.8 102.7 124.6 17.9 16.7 33.7Harari 105.3 107.5 105.7 50.2 59.6 56.1Addis Abeba 118.3 128.4 135.4 60.7 68.3 78.1Dire Dawa 75.7 80.2 78.6 32.0 28.3 50.3ETHIOPIA 57.4 61.6 64.4 12.9 17.1 19.3Source: Data based on EMIS, <strong>Education</strong> Statistics <strong>An</strong>nual Abstract, 2001; M<strong>in</strong>istry <strong>of</strong> <strong>Education</strong>, 2001; 200472
- Page 1 and 2:
Johanna LasonenRaija KemppainenKola
- Page 3 and 4:
THIS PUBLICATION CAN BE OBTAINED FR
- Page 5 and 6:
LIST OF ABBREVIATIONSAAUADLIAfDBAID
- Page 7 and 8:
YHTEENVETOJohanna Lasonen, Raija Ke
- Page 9 and 10:
hetkellä koulutus ei vastaa työvo
- Page 11 and 12:
empowerment. However, in Ethiopia a
- Page 13 and 14:
PREFACEAs educators we became inter
- Page 15 and 16:
1 HISTORY AND DEMOGRAPHICS OF ETIOP
- Page 17 and 18:
approximately 73 per cent for femal
- Page 19 and 20:
No of students7 000 0006 000 0005 0
- Page 21 and 22: an independent entity, cooperation
- Page 23 and 24: The other regional states have plan
- Page 25 and 26: Declaration of Education for All. T
- Page 27 and 28: OECD countries have committed thems
- Page 29 and 30: marriage by abduction, isolation du
- Page 31 and 32: making, metal work, agriculture, ho
- Page 33 and 34: 4 RESEARCH PROCEDURES4.1 Goals and
- Page 35 and 36: 5 RESULTSEducation has been a devel
- Page 37 and 38: These figures of growth transfer to
- Page 39 and 40: Only one out of ten children who en
- Page 41 and 42: Qualification rates are high among
- Page 43 and 44: ESDP policy. Increase of trained la
- Page 45 and 46: Table 9Number of Government-Owned a
- Page 47 and 48: elevant to Master of Arts (MA) stud
- Page 49 and 50: United States Agency for Internatio
- Page 51 and 52: Though the ETP stresses developing
- Page 53 and 54: Review Mission Report, 2003). Howev
- Page 55 and 56: the Bureau of Agriculture, the Bure
- Page 57 and 58: • jointly implemented projects, c
- Page 59 and 60: It is recommended that Finnish deve
- Page 61 and 62: alternative schooling centers tend
- Page 63 and 64: REFERENCESAlemu, Y. (2000). A compa
- Page 65 and 66: UNESCO. (2001). Education for All:
- Page 67 and 68: APPENDIX IINumber of Persons Interv
- Page 69 and 70: • SSEP; Bridging-vaihe/työsuunni
- Page 71: international co-operation. Teacher
- Page 75 and 76: Appendix IXTeacher Training Institu
- Page 77 and 78: decision makers, teacher educators,
- Page 79 and 80: The sustainability of the results d
- Page 81 and 82: The objectives and strategy of the
- Page 83 and 84: Benishangul-Gumuz with vocational t
- Page 85 and 86: Project RelevanceAn indication of F
- Page 87 and 88: The annual budget for these project
- Page 89: W O R KI N GP A P E R S23THE ECONOM


![to read the full report [pdf, Amharic] - Ethiopian Review](https://img.yumpu.com/52737829/1/190x245/to-read-the-full-report-pdf-amharic-ethiopian-review.jpg?quality=85)