Hornbach-Baumarkt-AG Group
PDF, 3,6 MB - Hornbach Holding AG
PDF, 3,6 MB - Hornbach Holding AG
- No tags were found...

You also want an ePaper? Increase the reach of your titles
YUMPU automatically turns print PDFs into web optimized ePapers that Google loves.
46 GROUP MAN<strong>AG</strong>EMENT REPORT Earnings Performance<br />
year. As a percentage of net sales, selling and store expenses<br />
rose from 30.3% to 31.1%.<br />
Due to the higher number of new store openings, pre-opening<br />
expenses grew from € 6.2 million to € 9.6 million (please also<br />
see Note 4). After three new store openings in the 2011/2012<br />
financial year, operations began at five new HORNBACH locations<br />
in the year under report. The pre-opening expense ratio<br />
increased from 0.2% to 0.3% as a result.<br />
Administration expenses grew by 16.2% to € 123.2 million in<br />
the year under report (2011/2012: € 106.1 million). As in the<br />
previous year, a major share of this increase was due to important<br />
forward-looking projects in the <strong>Group</strong>’s administrative<br />
departments. Among others, these include developing and<br />
extending our online retail and customer service activities, as<br />
well as innovations aimed at further optimizing our operating<br />
processes. In view of this, the administration expense ratio<br />
increased from 3.5% to 4.1%.<br />
Other income and expenses<br />
Other income and expenses showed a marked increase from<br />
€ 15.7 million to € 20.5 million in the year under report. One<br />
prime reason for this increase was the conclusive clarification<br />
of outstanding issues in connection with the supply of utility<br />
energies in Germany by the energy-related services provider<br />
we commissioned to this end. On this basis, it was possible to<br />
reverse provisions of € 3.9 million recognized in previous<br />
years. Other than this, other income and expenses also include<br />
an amount of € 1.6 million for compensation not yet<br />
invoiced, net of service amounts. A further reason for the<br />
increase in this item related to income from the group allocation,<br />
which rose from € 3.6 million to € 4.1 million. Furthermore,<br />
other income and expenses were positively influenced<br />
by a base effect within other non-operating income and expenses.<br />
In the 2011/2012 financial year, impairment losses in<br />
Romania were the main reason for negative other nonoperating<br />
income and expenses of minus € 1.4 million. In the<br />
year under report, by contrast, there were no material nonoperating<br />
items within other income and expenses.<br />
EBITDA and EBIT<br />
EBITDA in the DIY store segment fell 29.1% to € 107.7 million<br />
in the 2012/2013 financial year (2011/2012: € 152.0 million),<br />
equivalent to an EBITDA margin of 3.6% (2011/2012: 5.1%).<br />
Operating earnings (EBIT) dropped 35.9% to € 74.2 million<br />
(2011/2012: € 115.7 million). EBIT was equivalent to 2.5% of<br />
net sales in the year under report (2011/2012: 3.9%).<br />
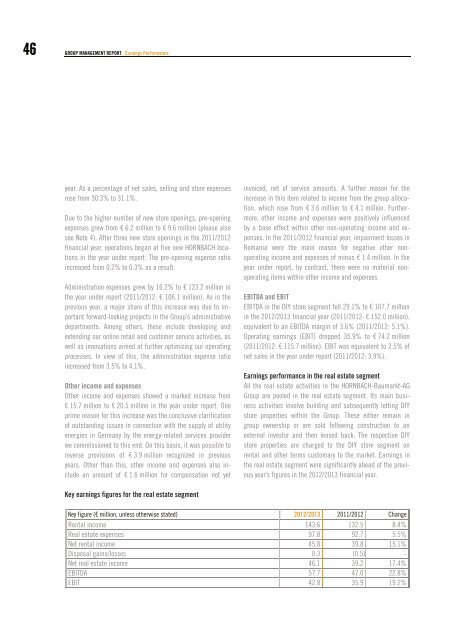
Earnings performance in the real estate segment<br />
All the real estate activities in the HORNBACH-<strong>Baumarkt</strong>-<strong>AG</strong><br />
<strong>Group</strong> are pooled in the real estate segment. Its main business<br />
activities involve building and subsequently letting DIY<br />
store properties within the <strong>Group</strong>. These either remain in<br />
group ownership or are sold following construction to an<br />
external investor and then leased back. The respective DIY<br />
store properties are charged to the DIY store segment on<br />
rental and other terms customary to the market. Earnings in<br />
the real estate segment were significantly ahead of the previous<br />
year’s figures in the 2012/2013 financial year.<br />
Key earnings figures for the real estate segment<br />
Key figure (€ million, unless otherwise stated) 2012/2013 2011/2012 Change<br />
Rental income 143.6 132.5 8.4%<br />
Real estate expenses 97.8 92.7 5.5%<br />
Net rental income 45.8 39.8 15.1%<br />
Disposal gains/losses 0.3 (0.5) -<br />
Net real estate income 46.1 39.2 17.4%<br />
EBITDA 57.7 47.0 22.8%<br />
EBIT 42.8 35.9 19.2%