Hornbach-Baumarkt-AG Group
PDF, 3,6 MB - Hornbach Holding AG
PDF, 3,6 MB - Hornbach Holding AG
- No tags were found...

Create successful ePaper yourself
Turn your PDF publications into a flip-book with our unique Google optimized e-Paper software.
54 GROUP MAN<strong>AG</strong>EMENT REPORT Asset Situation<br />
Asset Situation<br />
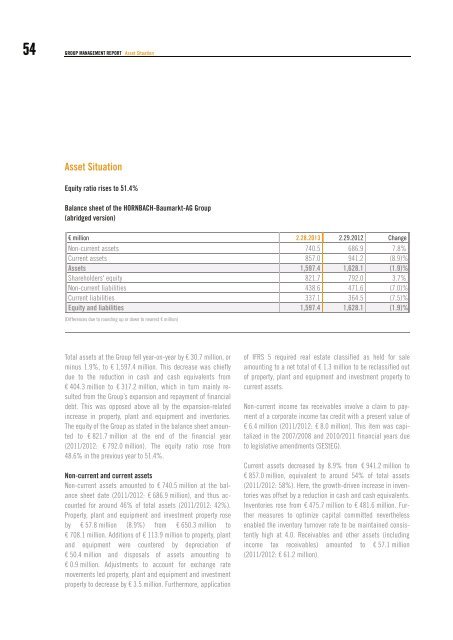
Equity ratio rises to 51.4%<br />
Balance sheet of the HORNBACH-<strong>Baumarkt</strong>-<strong>AG</strong> <strong>Group</strong><br />
(abridged version)<br />
€ million 2.28.2013 2.29.2012 Change<br />
Non-current assets 740.5 686.9 7.8%<br />
Current assets 857.0 941.2 (8.9)%<br />
Assets 1,597.4 1,628.1 (1.9)%<br />
Shareholders' equity 821.7 792.0 3.7%<br />
Non-current liabilities 438.6 471.6 (7.0)%<br />
Current liabilities 337.1 364.5 (7.5)%<br />
Equity and liabilities 1,597.4 1,628.1 (1.9)%<br />
(Differences due to rounding up or down to nearest € million)<br />
Total assets at the <strong>Group</strong> fell year-on-year by € 30.7 million, or<br />
minus 1.9%, to € 1,597.4 million. This decrease was chiefly<br />
due to the reduction in cash and cash equivalents from<br />
€ 404.3 million to € 317.2 million, which in turn mainly resulted<br />
from the <strong>Group</strong>’s expansion and repayment of financial<br />
debt. This was opposed above all by the expansion-related<br />
increase in property, plant and equipment and inventories.<br />
The equity of the <strong>Group</strong> as stated in the balance sheet amounted<br />
to € 821.7 million at the end of the financial year<br />
(2011/2012: € 792.0 million). The equity ratio rose from<br />
48.6% in the previous year to 51.4%.<br />
Non-current and current assets<br />
Non-current assets amounted to € 740.5 million at the balance<br />
sheet date (2011/2012: € 686.9 million), and thus accounted<br />
for around 46% of total assets (2011/2012: 42%).<br />
Property, plant and equipment and investment property rose<br />
by € 57.8 million (8.9%) from € 650.3 million to<br />
€ 708.1 million. Additions of € 113.9 million to property, plant<br />
and equipment were countered by depreciation of<br />
€ 50.4 million and disposals of assets amounting to<br />
€ 0.9 million. Adjustments to account for exchange rate<br />
movements led property, plant and equipment and investment<br />
property to decrease by € 3.5 million. Furthermore, application<br />
of IFRS 5 required real estate classified as held for sale<br />
amounting to a net total of € 1.3 million to be reclassified out<br />
of property, plant and equipment and investment property to<br />
current assets.<br />
Non-current income tax receivables involve a claim to payment<br />
of a corporate income tax credit with a present value of<br />
€ 6.4 million (2011/2012: € 8.0 million). This item was capitalized<br />
in the 2007/2008 and 2010/2011 financial years due<br />
to legislative amendments (SEStEG).<br />
Current assets decreased by 8.9% from € 941.2 million to<br />
€ 857.0 million, equivalent to around 54% of total assets<br />
(2011/2012: 58%). Here, the growth-driven increase in inventories<br />
was offset by a reduction in cash and cash equivalents.<br />
Inventories rose from € 475.7 million to € 481.6 million. Further<br />
measures to optimize capital committed nevertheless<br />
enabled the inventory turnover rate to be maintained consistently<br />
high at 4.0. Receivables and other assets (including<br />
income tax receivables) amounted to € 57.1 million<br />
(2011/2012: € 61.2 million).