- Page 1 and 2:
Carbohydrates and Health 2015
- Page 3 and 4:
Published by TSO (The Stationery Of
- Page 5 and 6:
performed the systematic review on
- Page 7 and 8:
Colo-rectal health Children and ado
- Page 9 and 10:
5 Fibre isolates 233 Psyllium 233
- Page 11 and 12:
Dr David Mela Prof. Angus Walls (si
- Page 13 and 14:
Prof. Ian Macdonald Prof. of Metab
- Page 15 and 16:
Summary S.1 Carbohydrates are a ma
- Page 17 and 18:
Sugars and sugars-sweetened foods a
- Page 19 and 20:
S.21 It is recommended that dietar
- Page 21 and 22:
1 Introduction and methods Backgrou
- Page 23 and 24:
used as the primary dietary assessm
- Page 25 and 26:
2.3 Carbohydrates can be classifie
- Page 27 and 28:
β-glucans are a heterogeneous grou
- Page 29 and 30:
2.19 The amount of energy yielded
- Page 31 and 32:
Definitions used in different dieta
- Page 33 and 34:
2.32 In the United States ‘total
- Page 35 and 36:
is associated with higher incidence
- Page 37 and 38:
3 Dietary sources and intakes of ca
- Page 39 and 40:
3.12 In adults aged 19-64 years, s
- Page 41 and 42:
3.24 At a broad food category leve
- Page 43 and 44:
were also significant contributors.
- Page 45 and 46:
4.5 Obesity occurs when energy int
- Page 47 and 48:
loose stools with fast transit thro
- Page 49 and 50:
Risk factors and measures considere
- Page 51 and 52:
important in trials assessing effec
- Page 53 and 54:
5.18 Two cohort studies were identi
- Page 55 and 56:
Higher carbohydrate, average protei
- Page 57 and 58:
Fasting blood lipids 5.32 Fifty ei
- Page 59 and 60:
evidence of an effect of higher car
- Page 61 and 62:
Higher carbohydrate, average protei
- Page 63 and 64:
to exclude confounding by concomita
- Page 65 and 66:
Fasting LDL-cholesterol 5.57 Twenty
- Page 67 and 68:
Fasting LDL-cholesterol:HDL-cholest
- Page 69 and 70:
Carbohydrate diets and C-reactive p
- Page 71 and 72:
not be included in a meta-analysis
- Page 73 and 74:
Phillips et al., 2008; Due et al.,
- Page 75 and 76:
concomitant weight loss on fasting
- Page 77 and 78:
5.105 Due to variation between the
- Page 79 and 80:
carbohydrates was less than 5% betw
- Page 81 and 82:
5.121 The heterogeneity is above t
- Page 83 and 84:
Higher carbohydrate and lower fat d
- Page 85 and 86:
5.138 No significant association is
- Page 87 and 88:
Table 5.2: Insufficient evidence -
- Page 89 and 90:
5.151 The trials do provide eviden
- Page 91 and 92:
6.7 No significant association is o
- Page 93 and 94:
al., 2006), which left an insuffici
- Page 95 and 96:
Sugars and energy intake • Effect
- Page 97 and 98:
Sucrose (g/day) and type 2 diabetes
- Page 99 and 100:
Sugars-sweetened beverages (ml/day)
- Page 101 and 102:
sugars-sweetened and non-caloricall
- Page 103 and 104:
6.53 No meta-analyses have been con
- Page 105 and 106:
foods. Five of these adjusted their
- Page 107 and 108:
Table 6.1: continued Risk factor/he
- Page 109 and 110:
that met the inclusion criteria. As
- Page 111 and 112:
7 Starch and starch-rich foods 7.1
- Page 113 and 114:
7.11 No association was found betwe
- Page 115 and 116:
were combined into a meta-analysis
- Page 117 and 118:
7.25 Findings from prospective coh
- Page 119 and 120:
2011; Park et al., 2011; Wallstrom
- Page 121 and 122:
Hays et al., 2006). The data were i
- Page 123 and 124:
Dietary fibre and fasting insulin c
- Page 125 and 126:
2007; Schatzkin et al., 2007; Wakai
- Page 127 and 128:
metabolic review, cardiovascular di
- Page 129 and 130:
Fruit fibre (g/day) and coronary ev
- Page 131 and 132:
(Salmeron et al., 1997a; Salmeron e
- Page 133 and 134:
Faecal weight and intestinal transi
- Page 135 and 136:
Coronary events 8.76 Eight cohort s
- Page 137 and 138:
Oat bran and β-glucans and fasting
- Page 139 and 140:
Oat bran and β-glucans and fasting
- Page 141 and 142:
al., 2008). The data on dietary int
- Page 143 and 144:
observes an increase in bowel movem
- Page 145 and 146:
Cereal fibre (g/day) and colo-recta
- Page 147 and 148:
Total cereals Cardiovascular diseas
- Page 149 and 150:
Whole grains (serving/day) and hype
- Page 151 and 152:
increases in vegetable, fruit, and
- Page 153 and 154:
8.150 Due to variation between the
- Page 155 and 156:
Table 8.1: continued Risk factor/he
- Page 157 and 158:
Table 8.3: Inconsistent evidence Ri
- Page 159 and 160:
9 Non-digestible oligosaccharides,
- Page 161 and 162:
Forcheron & Beylot, 2007). One tria
- Page 163 and 164:
trial administers 21g/day inulin co
- Page 165 and 166:
coffee (Walton et al., 2010). All t
- Page 167 and 168:
Arabinoxylan-oligosaccharides 9.33
- Page 169 and 170:
9.42 An effect of raw resistant sta
- Page 171 and 172:
1999c) or retrograde resistant star
- Page 173 and 174:
9.61 All three trials demonstrate
- Page 175 and 176:
Non-digestible oligosaccharide (fru
- Page 177 and 178:
9.76 Of the five trials that inves
- Page 179 and 180:
Table 9.2: Inconsistent evidence -
- Page 181 and 182:
10 Glycaemic index and glycaemic lo
- Page 183 and 184:
Stroke 10.10 Three cohort studies w
- Page 185 and 186:
10.18 No significant effect of GI i
- Page 187 and 188:
Glycaemic index (unit/day) and fast
- Page 189 and 190:
10.38 No significant effect is demo
- Page 191 and 192:
health review (Greenwood et al., 20
- Page 193 and 194:
Table 10.1: Insufficient evidence -
- Page 195 and 196:
11 Dietary recommendations 11.1 T
- Page 197 and 198:
energy compensation (degree of volu
- Page 199 and 200:
Dietary fibre 11.17 In 1991 COMA s
- Page 201 and 202:
with any adverse effects on growth
- Page 203 and 204:
Figure 11.4: Risk of type 2 diabete
- Page 205 and 206:
12 Overall summary and conclusions
- Page 207 and 208:
permanent dentitions. There is a la
- Page 209 and 210:
supplements on recurrence of colo-r
- Page 211 and 212:
• With the proposed reduction in
- Page 213 and 214:
sweet spreads, fruit juice, confect
- Page 215 and 216:
ANNEX 1 Cardio-metabolic, colo-rect
- Page 217 and 218:
frequency and age. For oral cancer,
- Page 219 and 220:
framework for the evaluation of evi
- Page 221 and 222:
• Whether the effect or associati
- Page 223 and 224:
Commentary on the evidence on fruct
- Page 225 and 226:
A3.9 There are few data from trial
- Page 227 and 228:
mechanism may have been acting for
- Page 229 and 230:
Table A4.1: Prospective cohort stud
- Page 231 and 232:
Randomised controlled trials A4.14
- Page 233 and 234:
Table A4.3: continued Study Trial d
- Page 235 and 236:
Table A4.3: continued Study Trial d
- Page 237 and 238:
TableA4.4: Risk of bias assessment
- Page 239 and 240:
TableA4.5: Results from prospective
- Page 241 and 242: likely to progress in subjects who
- Page 243 and 244: Table A4.6: continued Study Interve
- Page 245 and 246: A4.37 The effect of one litre a day
- Page 247 and 248: Fibre isolates ANNEX 5 A5.1 Prospe
- Page 249 and 250: Constipation A5.9 Four randomised c
- Page 251 and 252: Isolated gums and gelling agent sup
- Page 253 and 254: a meta-analysis. Overall, the trial
- Page 255 and 256: Mixed isolated gums and gelling age
- Page 257 and 258: Risk factor/health outcome/measure
- Page 259 and 260: IL-6 Interleukin 6 J Joule kcal Kil
- Page 261 and 262: A7.4 Higher birth weight is associ
- Page 263 and 264: A7.17 One cohort study observed tha
- Page 265 and 266: Carbohydrate intake (% energy) and
- Page 267 and 268: Summary and conclusions A7.31 This
- Page 269 and 270: P P er er c c ent ent Top tw Top tw
- Page 271 and 272: Table 3.2: Average daily intake of
- Page 273 and 274: Table 3.4: Average daily intake of
- Page 275 and 276: Table 3.6: Average daily intake of
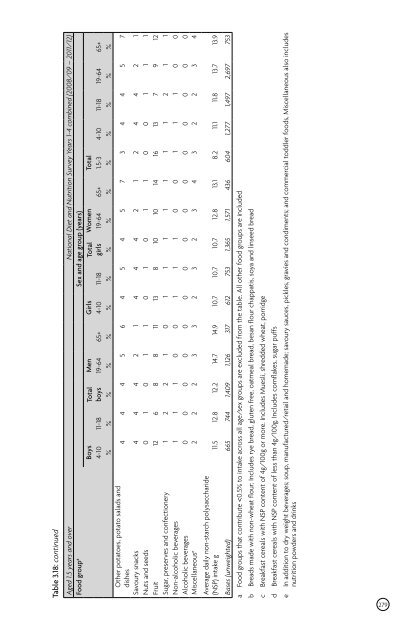
- Page 277 and 278: Table 3.8: Average daily intake of
- Page 279 and 280: Table 3.10: Average daily intake of
- Page 281 and 282: Table 3.12: Average daily intake of
- Page 283 and 284: Table 3.13b: Total quantities consu
- Page 285 and 286: Table 3.14b: Total quantities consu
- Page 287 and 288: Table 3.15b: Total quantities consu
- Page 289 and 290: Table 3.16: continued Aged 1.5 year
- Page 291: Table 3.17: continued Aged 1.5 year
- Page 295 and 296: Table 3.19b: Top 20 contributors to
- Page 297 and 298: Table 3.19d: Top 20 contributors to
- Page 299 and 300: Table 3.20a: Top 20 contributors to
- Page 301 and 302: Table 3.20c: Top 20 contributors to
- Page 303 and 304: Table 3.20e: Top 20 contributors to
- Page 305 and 306: Table 3.21b: Top 20 contributors to
- Page 307 and 308: Table 3.21d: Top 20 contributors to
- Page 309 and 310: Table 3.22a: Top 20 contributors to
- Page 311 and 312: Table 3.22c: Top 20 contributors to
- Page 313 and 314: Table 3.22e: Top 20 contributors to
- Page 315 and 316: A9.1 The meta-analysis was perform
- Page 317 and 318: A9.3 The difference in sugars inta
- Page 319 and 320: References Abete I, Parra D & Marti
- Page 321 and 322: Asayama K, Thijs L, Brguljan-Hitij
- Page 323 and 324: Beiswanger BB, Boneta AE, Jau MS, K
- Page 325 and 326: Bouhnik Y, Flourie B, Riottot M, Bi
- Page 327 and 328: Campain AC, Morgan MV, Evans RW, Ug
- Page 329 and 330: COMA (1991) Dietary Reference Value
- Page 331 and 332: Davy BM, Melby CL, Beske SD, Ho RC,
- Page 333 and 334: Due A, Toubro S, Skov AR & Astrup A
- Page 335 and 336: Esrey KL, Joseph L & Grover SA (199
- Page 337 and 338: Francois IE, Lescroart O, Veraverbe
- Page 339 and 340: Grasten SM, Juntunen KS, Poutanen K
- Page 341 and 342: Health and Social Care Information
- Page 343 and 344:
Howarth NC, Murphy SP, Wilkens LR,
- Page 345 and 346:
Jenkins DJ, Vuksan V, Kendall CW, W
- Page 347 and 348:
Keogh JB, Brinkworth GD, Noakes M,
- Page 349 and 350:
Kvaavik E, Andersen LF & Klepp KI (
- Page 351 and 352:
Levine RS, Nugent ZJ, Rudolf MC & S
- Page 353 and 354:
Livesey G (2003) Health potential o
- Page 355 and 356:
Marteau P, Flourie B, Cherbut C, Co
- Page 357 and 358:
Miller M, Stone NJ, Ballantyne C, e
- Page 359 and 360:
Nissinen K, Mikkila V, Mannisto S,
- Page 361 and 362:
Pasman W, Wils D, Saniez MH & Kardi
- Page 363 and 364:
Pitts NB, Chestnutt IG, Evans D, Wh
- Page 365 and 366:
Ross R (1999) Atherosclerosis--an i
- Page 367 and 368:
Sarwar N, Gao P, Seshasai SR, et al
- Page 369 and 370:
Sharman MJ, Gomez AL, Kraemer WJ &
- Page 371 and 372:
Sorensen LB, Vasilaras TH, Astrup A
- Page 373 and 374:
Striegel-Moore RH, Thompson D, Affe
- Page 375 and 376:
Terry P, Giovannucci E, Michels KB,
- Page 377 and 378:
Tuohy KM, Kolida S, Lustenberger AM
- Page 379 and 380:
Vester Boler BM, Serao MC, Bauer LL
- Page 381 and 382:
West NX, Hughes JA, Parker D, Weave
- Page 383:
Wycherley TP, Brinkworth GD, Keogh