


Create successful ePaper yourself
Turn your PDF publications into a flip-book with our unique Google optimized e-Paper software.
<strong>Intel®</strong> <strong>Media</strong> <strong>Server</strong> <strong>Studio</strong> <strong>HEVC</strong> Software Decoder <strong>Performance</strong> for<br />
4:2:0 8-bit Content<br />
In this section we describe results of decoding speed measurement of <strong>Intel®</strong> <strong>Media</strong> <strong>Server</strong> <strong>Studio</strong> <strong>HEVC</strong><br />
Decoder. For measurement of decoding speed (fps), the same reference PC Platform (<strong>Intel®</strong> Core i7-<br />
4770K CPU @ 3.5 GHz – 4 Cores/8 Threads) used for encoding speed measurement is employed.<br />
<strong>Deliver</strong> <strong>High</strong> <strong>Quality</strong>, <strong>High</strong> <strong>Performance</strong> <strong>HEVC</strong> <strong>via</strong> <strong>Intel®</strong> <strong>Media</strong> <strong>Server</strong> <strong>Studio</strong><br />
34<br />
The <strong>Media</strong> <strong>Server</strong> <strong>Studio</strong> <strong>HEVC</strong> Software Decoder is able to achieve very high threading throughput<br />
consuming over 90% of resources on the noted machine.<br />
For measurement of decoder performance, longer bitstreams of typically around 1000 or more frames are<br />
necessary to obtain a stable measurement. Thus, each of the video sequences of Table 0A-0D since they<br />
are relatively short were extended by palindromic repetition (so as not to introduce sudden scene<br />
changes that might introduce an unnatural behavior in the measurement) to 900 – 1200 frames long and<br />
compressed with <strong>HEVC</strong> using the same Qp quantizers as in Table 0A-0D. These longer compressed<br />
streams were then used for decoder performance measurment.<br />
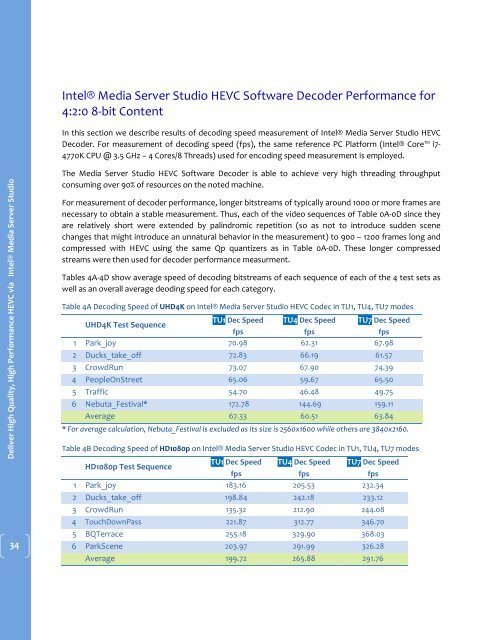
Tables 4A-4D show average speed of decoding bitstreams of each sequence of each of the 4 test sets as<br />
well as an overall average deoding speed for each category.<br />
Table 4A Decoding Speed of UHD4K on <strong>Intel®</strong> <strong>Media</strong> <strong>Server</strong> <strong>Studio</strong> <strong>HEVC</strong> Codec in TU1, TU4, TU7 modes<br />
UHD4K Test Sequence<br />
TU1 Dec Speed TU4 Dec Speed TU7 Dec Speed<br />
fps fps fps<br />
1 Park_joy 70.98 62.31 67.98<br />
2 Ducks_take_off 72.83 66.19 61.57<br />
3 CrowdRun 73.07 67.90 74.39<br />
4 PeopleOnStreet 65.06 59.67 65.50<br />
5 Traffic 54.70 46.48 49.75<br />
6 Nebuta_Festival* 172.78 144.69 159.11<br />
Average 67.33 60.51 63.84<br />
* For average calculation, Nebuta_Festival is excluded as its size is 2560x1600 while others are 3840x2160.<br />
Table 4B Decoding Speed of HD1080p on <strong>Intel®</strong> <strong>Media</strong> <strong>Server</strong> <strong>Studio</strong> <strong>HEVC</strong> Codec in TU1, TU4, TU7 modes<br />
HD1080p Test Sequence<br />
TU1 Dec Speed TU4 Dec Speed TU7 Dec Speed<br />
fps fps fps<br />
1 Park_joy 183.16 205.53 232.34<br />
2 Ducks_take_off 198.84 242.18 233.12<br />
3 CrowdRun 135.32 212.90 244.08<br />
4 TouchDownPass 221.87 312.77 346.70<br />
5 BQTerrace 255.18 329.90 368.03<br />
6 ParkScene 203.97 291.99 326.28<br />
Average 199.72 265.88 291.76