


You also want an ePaper? Increase the reach of your titles
YUMPU automatically turns print PDFs into web optimized ePapers that Google loves.
<strong>Quality</strong> Evaluation Results for 4:2:2 8-bit Content<br />
Before discussing detailed BD rate differences of each <strong>Media</strong> <strong>Server</strong> <strong>Studio</strong> TU mode wrt HM14, we first<br />
establish the quality/bitrate tradeoff of HM 14 that will be used as reference.<br />
HD1080p Test<br />
Sequence<br />
First, each video sequence of each test set (such as HD1080p, 720p) is encoded using MPEG <strong>HEVC</strong> HM14<br />
Reference Encoder with each of 4 quantizers as specified in Tables 11A-11B. The overall PSNR (averaged<br />
over frames) for each test sequence for each Qp for each of luma (Y), and associated chroma<br />
components (U and V) is collected along with the generated coding bitrate. For instance, Tables 12A-12B<br />
show the luma PSNR (chroma PSNR is also collected but is not shown to keep tables manageable in size)<br />
and total bitrate for each test sequence for each of 4 Qps is collected and is used in curve fitting to<br />
generate a continuous RD curve for HM14 encoding of that test sequence.<br />
Next, <strong>Media</strong> <strong>Server</strong> <strong>Studio</strong> <strong>HEVC</strong> Software Encoder in each of its 4 main modes: TU1, TU4, TU7, and<br />
TU7gacc is utilized to perform encoding of each test sequence with each of 4 quantizers (of Table 11A-11B)<br />
used in HM 14 encoding, and PSNRs of Y, U, and V, and total bitrates are collected for each test.<br />
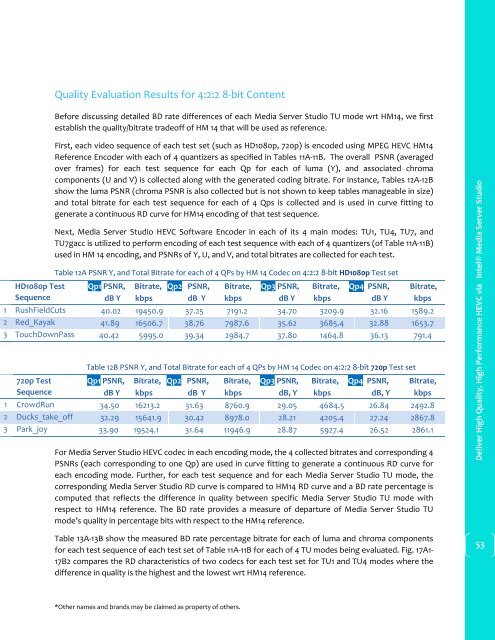
Table 12A PSNR Y, and Total Bitrate for each of 4 QPs by HM 14 Codec on 4:2:2 8-bit HD1080p Test set<br />
Qp1 PSNR, Bitrate, Qp2 PSNR, Bitrate, Qp3 PSNR, Bitrate, Qp4 PSNR, Bitrate,<br />
dB Y kbps dB Y kbps dB Y kbps dB Y kbps<br />
1 RushFieldCuts 40.02 19450.9 37.25 7191.2 34.70 3209.9 32.16 1589.2<br />
2 Red_Kayak 41.89 16506.7 38.76 7987.6 35.62 3685.4 32.88 1653.7<br />
3 TouchDownPass 40.42 5995.0 39.34 2984.7 37.80 1464.8 36.13 791.4<br />
720p Test<br />
Sequence<br />
Table 12B PSNR Y, and Total Bitrate for each of 4 QPs by HM 14 Codec on 4:2:2 8-bit 720p Test set<br />
Qp1 PSNR, Bitrate, Qp2 PSNR, Bitrate, Qp3 PSNR, Bitrate, Qp4 PSNR, Bitrate,<br />
dB Y kbps dB Y kbps dB, Y kbps dB, Y kbps<br />
1 CrowdRun 34.50 16213.2 31.63 8760.9 29.05 4684.5 26.84 2492.8<br />
2 Ducks_take_off 32.29 15641.9 30.42 8978.0 28.21 4205.4 27.24 2867.8<br />
3 Park_joy 33.90 19524.1 31.64 11946.9 28.87 5927.4 26.52 2861.1<br />
For <strong>Media</strong> <strong>Server</strong> <strong>Studio</strong> <strong>HEVC</strong> codec in each encoding mode, the 4 collected bitrates and corresponding 4<br />
PSNRs (each corresponding to one Qp) are used in curve fitting to generate a continuous RD curve for<br />
each encoding mode. Further, for each test sequence and for each <strong>Media</strong> <strong>Server</strong> <strong>Studio</strong> TU mode, the<br />
corresponding <strong>Media</strong> <strong>Server</strong> <strong>Studio</strong> RD curve is compared to HM14 RD curve and a BD rate percentage is<br />
computed that reflects the difference in quality between specific <strong>Media</strong> <strong>Server</strong> <strong>Studio</strong> TU mode with<br />
respect to HM14 reference. The BD rate provides a measure of departure of <strong>Media</strong> <strong>Server</strong> <strong>Studio</strong> TU<br />
mode’s quality in percentage bits with respect to the HM14 reference.<br />
<strong>Deliver</strong> <strong>High</strong> <strong>Quality</strong>, <strong>High</strong> <strong>Performance</strong> <strong>HEVC</strong> <strong>via</strong> <strong>Intel®</strong> <strong>Media</strong> <strong>Server</strong> <strong>Studio</strong><br />
Table 13A-13B show the measured BD rate percentage bitrate for each of luma and chroma components<br />
for each test sequence of each test set of Table 11A-11B for each of 4 TU modes being evaluated. Fig. 17A1-<br />
17B2 compares the RD characteristics of two codecs for each test set for TU1 and TU4 modes where the<br />
difference in quality is the highest and the lowest wrt HM14 reference.<br />
53<br />
*Other names and brands may be claimed as property of others.