


Create successful ePaper yourself
Turn your PDF publications into a flip-book with our unique Google optimized e-Paper software.
For instance, Table 13A shows on HD1080p test set, the BD rate percentage difference of <strong>Media</strong> <strong>Server</strong><br />
<strong>Studio</strong> <strong>HEVC</strong> in various TU modes wrt HM14 reference. As can be observed on HD1080p test set, the<br />
average luma BD rate percentage difference of <strong>Media</strong> <strong>Server</strong> <strong>Studio</strong> <strong>HEVC</strong> Codec over HM14 (an ideal<br />
reference), is 5.1%, 16.9%, 33.7%, and 37.8%, higher respectively in TU1, TU4, TU7, and TU7gacc modes. This<br />
means that for HD1080p test set, the <strong>Media</strong> <strong>Server</strong> <strong>Studio</strong> codec as compared to HM14, requires around<br />
5% higher bitrate in TU1 mode, 17% higher bitrate in TU4 mode, 34% higher bitrate in TU7 mode, and 38%<br />
higher bitrate in TU7gacc mode to achieve the same luma PSNR quality as HM14.<br />
<strong>Deliver</strong> <strong>High</strong> <strong>Quality</strong>, <strong>High</strong> <strong>Performance</strong> <strong>HEVC</strong> <strong>via</strong> <strong>Intel®</strong> <strong>Media</strong> <strong>Server</strong> <strong>Studio</strong><br />
Table 13A Relative <strong>Quality</strong> Evaluation Results on 4:2:2 8-bit HD1080p test set for <strong>Intel®</strong> <strong>Media</strong> <strong>Server</strong> <strong>Studio</strong> <strong>HEVC</strong><br />
Software Codec in TU1, TU4, TU7, and TU7gacc modes with respect to MPEG <strong>HEVC</strong> HM14 Codec<br />
HD1080p Test<br />
Sequence<br />
TU1 BD rate, %age TU4 BD rate, %age TU7 BD rate, %age TU7gacc BD rate, %age<br />
Y U V Y U V Y U V Y U V<br />
1 RushFieldCuts 5.97 -8.21 -7.79 17.62 13.59 17.81 35.61 41.99 51.07 38.21 43.48 52.77<br />
2 Red_Kayak 3.19 -17.06 -13.96 12.44 -9.92 3.45 25.06 8.92 30.58 26.46 11.50 31.31<br />
3 TouchDownPass 6.22 -4.51 -4.29 20.67 18.93 17.65 40.45 57.78 54.72 48.83 61.28 58.16<br />
Average 5.12 -9.92 -8.68 16.91 7.53 12.97 33.71 36.23 45.46 37.83 38.75 47.41<br />
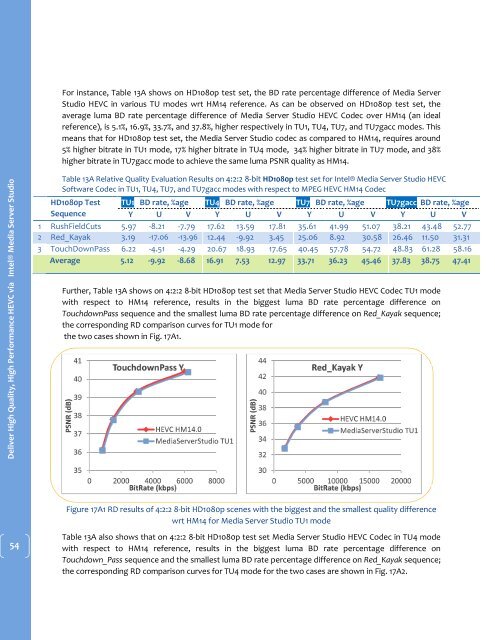
Further, Table 13A shows on 4:2:2 8-bit HD1080p test set that <strong>Media</strong> <strong>Server</strong> <strong>Studio</strong> <strong>HEVC</strong> Codec TU1 mode<br />
with respect to HM14 reference, results in the biggest luma BD rate percentage difference on<br />
TouchdownPass sequence and the smallest luma BD rate percentage difference on Red_Kayak sequence;<br />
the corresponding RD comparison curves for TU1 mode for<br />
the two cases shown in Fig. 17A1.<br />
PSNR (dB)<br />
41<br />
40<br />
39<br />
38<br />
37<br />
36<br />
TouchdownPass Y<br />
<strong>HEVC</strong> HM14.0<br />
<strong>Media</strong><strong>Server</strong><strong>Studio</strong> TU1<br />
PSNR (dB)<br />
44<br />
42<br />
40<br />
38<br />
36<br />
34<br />
32<br />
Red_Kayak Y<br />
<strong>HEVC</strong> HM14.0<br />
<strong>Media</strong><strong>Server</strong><strong>Studio</strong> TU1<br />
35<br />
0 2000 4000 6000 8000<br />
BitRate (kbps)<br />
30<br />
0 5000 10000 15000 20000<br />
BitRate (kbps)<br />
Figure 17A1 RD results of 4:2:2 8-bit HD1080p scenes with the biggest and the smallest quality difference<br />
wrt HM14 for <strong>Media</strong> <strong>Server</strong> <strong>Studio</strong> TU1 mode<br />
54<br />
Table 13A also shows that on 4:2:2 8-bit HD1080p test set <strong>Media</strong> <strong>Server</strong> <strong>Studio</strong> <strong>HEVC</strong> Codec in TU4 mode<br />
with respect to HM14 reference, results in the biggest luma BD rate percentage difference on<br />
Touchdown_Pass sequence and the smallest luma BD rate percentage difference on Red_Kayak sequence;<br />
the corresponding RD comparison curves for TU4 mode for the two cases are shown in Fig. 17A2.