


You also want an ePaper? Increase the reach of your titles
YUMPU automatically turns print PDFs into web optimized ePapers that Google loves.
Table 5B Relative <strong>Quality</strong> Evaluation Results on HD1080p test set for <strong>Intel®</strong> <strong>Media</strong> <strong>Server</strong> <strong>Studio</strong> <strong>HEVC</strong> Software Codec<br />
in TU1, TU4, and TU7 modes with respect to MPEG <strong>HEVC</strong> HM14 Codec<br />
HD1080p Test<br />
Sequence<br />
TU1 BD rate, %age TU4 BD rate, %age TU7 BD rate, %age<br />
Y U V Y U V Y U V<br />
1 Park_joy 1.13 5.41 1.63 13.42 16.96 27.48 26.40 32.88 42.50<br />
2 Ducks_take_off 0.55 2.78 7.08 10.49 -3.20 21.87 20.40 11.05 38.23<br />
3 CrowdRun 1.03 3.32 2.83 16.51 22.24 23.07 35.12 48.29 50.21<br />
4 TouchDownPass 0.83 -5.35 -4.83 19.31 17.53 17.80 38.34 53.74 50.80<br />
5 BQTerrace 4.06 -14.83 -22.44 26.64 24.92 31.83 49.85 41.01 61.06<br />
6 ParkScene 2.69 -6.04 -7.99 17.45 21.24 19.67 33.31 40.70 36.60<br />
Average 1.71 -2.45 -3.96 17.30 16.61 23.62 33.90 37.94 46.57<br />
From Table 5A and 5B we can see that results on encoding server configuration used for E5 for all three TU’s<br />
provide identical high video quality to the configuration tested earlier for i7 processor 4770K, 4-core used for<br />
all other tests in this white paper.<br />
Encoder <strong>Quality</strong> vs <strong>Performance</strong> Tradeoff for TU Modes for Computational<br />
Scalability Tests for 4:2:0 8-bit<br />
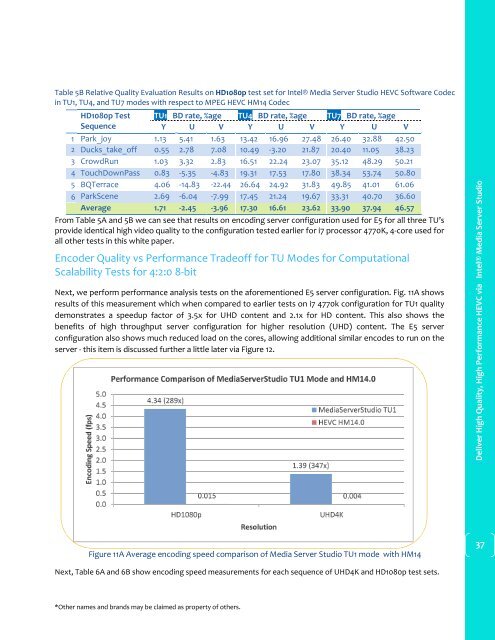
Next, we perform performance analysis tests on the aforementioned E5 server configuration. Fig. 11A shows<br />
results of this measurement which when compared to earlier tests on i7 4770k configuration for TU1 quality<br />
demonstrates a speedup factor of 3.5x for UHD content and 2.1x for HD content. This also shows the<br />
benefits of high throughput server configuration for higher resolution (UHD) content. The E5 server<br />
configuration also shows much reduced load on the cores, allowing additional similar encodes to run on the<br />
server - this item is discussed further a little later <strong>via</strong> Figure 12.<br />
Encoding Speed (fps)<br />
5.0<br />
4.5<br />
4.0<br />
3.5<br />
3.0<br />
2.5<br />
2.0<br />
1.5<br />
1.0<br />
0.5<br />
0.0<br />
<strong>Performance</strong> Comparison of <strong>Media</strong><strong>Server</strong><strong>Studio</strong> TU1 Mode and HM14.0<br />
4.34 (289x)<br />
HD1080p<br />
1.39 (347x)<br />
0.015 0.004<br />
Resolution<br />
<strong>Media</strong><strong>Server</strong><strong>Studio</strong> TU1<br />
<strong>HEVC</strong> HM14.0<br />
UHD4K<br />
Figure 11A Average encoding speed comparison of <strong>Media</strong> <strong>Server</strong> <strong>Studio</strong> TU1 mode with HM14<br />
<strong>Deliver</strong> <strong>High</strong> <strong>Quality</strong>, <strong>High</strong> <strong>Performance</strong> <strong>HEVC</strong> <strong>via</strong> <strong>Intel®</strong> <strong>Media</strong> <strong>Server</strong> <strong>Studio</strong><br />
37<br />
Next, Table 6A and 6B show encoding speed measurements for each sequence of UHD4K and HD1080p test sets.<br />
*Other names and brands may be claimed as property of others.