Deliverables and Services - IHP Microelectronics
Deliverables and Services - IHP Microelectronics
Deliverables and Services - IHP Microelectronics

You also want an ePaper? Increase the reach of your titles
YUMPU automatically turns print PDFs into web optimized ePapers that Google loves.
60 A n n u A l R e p o R t 2 0 0 9<br />
A u S G e w ä H L t e p r o J e K t e – S e L e C t e d p r o J e C t S<br />
Typische Photolumineszenz-Spektren, die an verschiedenen<br />
Proben gemessen wurden, sind in Abb. 30 dargestellt.<br />
Ein Vergleich zwischen der Struktur (Abb. 29)<br />
und der Lumineszenz (Abb. 30) zeigt, dass die D1-Intensität<br />
durch die Dichte der Schraubenversetzungen<br />
bestimmt wird. Weiterhin ergibt sich, dass die nichtstrahlende<br />
Rekombinationsaktivität von der Dichte der<br />
Stufenversetzungen abhängt. Die in Abb. 31 graphisch<br />
zusammengestellten Daten liefern einen starken Hinweis<br />
darauf, dass die Versetzungslumineszenz mit aufgespaltenen<br />
Partial-Versetzungen verknüpft ist, da erst<br />
für Drehwinkel α TW > 3° die Transformation des Netzwerkes<br />
in einen Typ mit nicht aufgespaltenen Versetzungen<br />
zu beobachten ist.<br />
Unsere experimentellen Ergebnisse legen den Schluss<br />
nahe, dass Schraubenversetzungen für das Auftreten<br />
der D1-Linie verantwortlich sind, wohingegen Stufenversetzungen<br />
die nicht-strahlende Rekombination an<br />
den Netzwerken sowie die D3- und die D4-Linie (hier<br />
nicht gezeigt) verursachen. Die nicht-strahlende Rekombination<br />
der Stufenversetzungen sollte auf ihre<br />
starke Getterwirkung für sogenannte tiefe Verunreingungen<br />
zurückzuführen sein. Die Getterwirkung der<br />
Schraubenversetzungen ist dagegen sehr gering.<br />
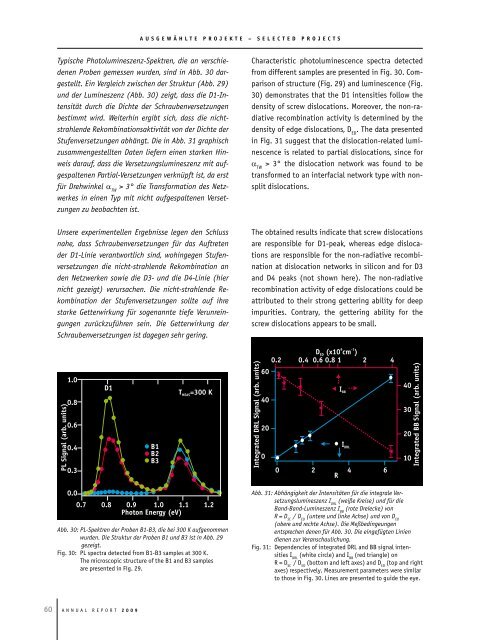
Abb. 30: PL-Spektren der Proben B1-B3, die bei 300 K aufgenommen<br />
wurden. Die Struktur der Proben B1 und B3 ist in Abb. 29<br />
gezeigt.<br />
Fig. 30: pl spectra detected from B1-B3 samples at 300 K.<br />
the microscopic structure of the B1 <strong>and</strong> B3 samples<br />
are presented in Fig. 29.<br />
Characteristic photoluminescence spectra detected<br />
from different samples are presented in Fig. 30. Comparison<br />
of structure (Fig. 29) <strong>and</strong> luminescence (Fig.<br />
30) demonstrates that the D1 intensities follow the<br />
density of screw dislocations. Moreover, the non-radiative<br />
recombination activity is determined by the<br />
density of edge dislocations, D eD . the data presented<br />
in Fig. 31 suggest that the dislocation-related luminescence<br />
is related to partial dislocations, since for<br />
α tW > 3° the dislocation network was found to be<br />
transformed to an interfacial network type with nonsplit<br />
dislocations.<br />
the obtained results indicate that screw dislocations<br />
are responsible for D1-peak, whereas edge dislocations<br />
are responsible for the non-radiative recombination<br />
at dislocation networks in silicon <strong>and</strong> for D3<br />
<strong>and</strong> D4 peaks (not shown here). the non-radiative<br />
recombination activity of edge dislocations could be<br />
attributed to their strong gettering ability for deep<br />
impurities. Contrary, the gettering ability for the<br />
screw dislocations appears to be small.<br />
Abb. 31: Abhängigkeit der Intensitäten für die integrale Versetzungslumineszenz<br />
I DRL (weiße Kreise) und für die<br />
B<strong>and</strong>-B<strong>and</strong>-Lumineszenz I BB (rote Dreiecke) von<br />
R = D SC / D ED (untere und linke Achse) und von D ED<br />
(obere und rechte Achse). Die Meßbedingeungen<br />
entsprechen denen für Abb. 30. Die eingefügten Linien<br />
dienen zur Veranschaulichung.<br />
Fig. 31: Dependencies of integrated DRl <strong>and</strong> BB signal intensities<br />
I DRl (white circle) <strong>and</strong> I BB (red triangle) on<br />
R = D SC / D eD (bottom <strong>and</strong> left axes) <strong>and</strong> D eD (top <strong>and</strong> right<br />
axes) respectively. Measurement parameters were similar<br />
to those in Fig. 30. lines are presented to guide the eye.