

NATIONAL
1OzYqKR
1OzYqKR

You also want an ePaper? Increase the reach of your titles
YUMPU automatically turns print PDFs into web optimized ePapers that Google loves.
HEALTH BEHAVIOUR IN SCHOOL-AGED CHILDREN:<br />
WHO COLLABORATIVE CROSS-<strong>NATIONAL</strong> STUDY (HBSC)<br />
2014 SURVEY IN SCOTLAND <strong>NATIONAL</strong> REPORT<br />
1<br />
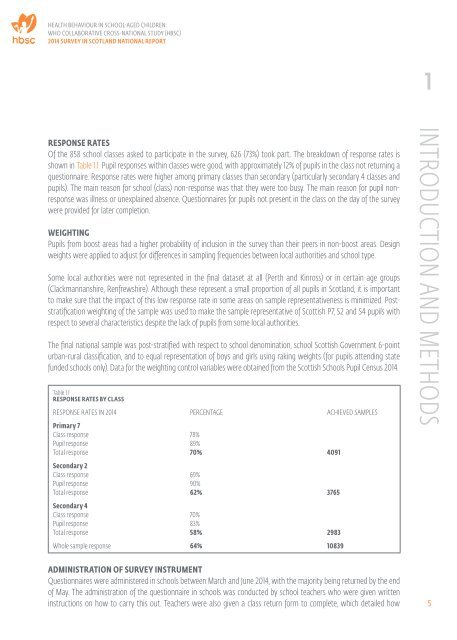
RESPONSE RATES<br />
Of the 858 school classes asked to participate in the survey, 626 (73%) took part. The breakdown of response rates is<br />
shown in Table 1.1. Pupil responses within classes were good, with approximately 12% of pupils in the class not returning a<br />
questionnaire. Response rates were higher among primary classes than secondary (particularly secondary 4 classes and<br />
pupils). The main reason for school (class) non-response was that they were too busy. The main reason for pupil nonresponse<br />
was illness or unexplained absence. Questionnaires for pupils not present in the class on the day of the survey<br />
were provided for later completion.<br />
WEIGHTING<br />
Pupils from boost areas had a higher probability of inclusion in the survey than their peers in non-boost areas. Design<br />
weights were applied to adjust for differences in sampling frequencies between local authorities and school type.<br />
Some local authorities were not represented in the final dataset at all (Perth and Kinross) or in certain age groups<br />
(Clackmannanshire, Renfrewshire). Although these represent a small proportion of all pupils in Scotland, it is important<br />
to make sure that the impact of this low response rate in some areas on sample representativeness is minimized. Poststratification<br />
weighting of the sample was used to make the sample representative of Scottish P7, S2 and S4 pupils with<br />
respect to several characteristics despite the lack of pupils from some local authorities.<br />
The final national sample was post-stratified with respect to school denomination, school Scottish Government 6-point<br />
urban-rural classification, and to equal representation of boys and girls using raking weights (for pupils attending state<br />
funded schools only). Data for the weighting control variables were obtained from the Scottish Schools Pupil Census 2014.<br />
Table 1.1<br />
RESPONSE RATES BY CLASS<br />
RESPONSE RATES IN 2014 PERCENTAGE ACHIEVED SAMPLES<br />
Primary 7<br />
Class response 78%<br />
Pupil response 89%<br />
Total response 70% 4091<br />
Secondary 2<br />
Class response 69%<br />
Pupil response 90%<br />
Total response 62% 3765<br />
Secondary 4<br />
Class response 70%<br />
Pupil response 83%<br />
Total response 58% 2983<br />
Whole sample response 64% 10839<br />
INTRODUCTION AND METHODS<br />
ADMINISTRATION OF SURVEY INSTRUMENT<br />
Questionnaires were administered in schools between March and June 2014, with the majority being returned by the end<br />
of May. The administration of the questionnaire in schools was conducted by school teachers who were given written<br />
instructions on how to carry this out. Teachers were also given a class return form to complete, which detailed how<br />
5