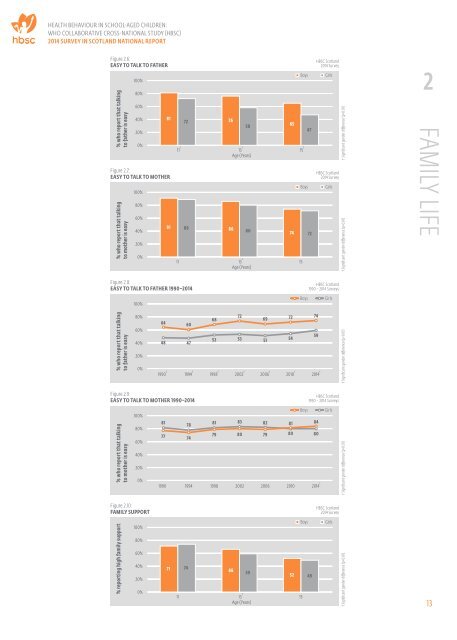
HEALTH BEHAVIOUR IN SCHOOL-AGED CHILDREN: WHO COLLABORATIVE CROSS-<strong>NATIONAL</strong> STUDY (HBSC) 2014 SURVEY IN SCOTLAND <strong>NATIONAL</strong> REPORT FAMILY AFFLUENCE Children and young people are often unable to give sufficient information about their parents’ occupational status, therefore assigning an SES score can be problematic. Indicators of family affluence can be used as an alternative, allowing approximation of socio-economic status. Young people were asked to report (a) the number of cars in their family, (b) the number of computers at home, (c) the number of family holidays taken abroad in the previous 12 months, (d) if they have their own bedroom, (e) the number of bathrooms in their home and (f) whether their household has a dishwasher. The Family Affluence Score (FAS) is a validated measure derived from these items and children are classified as having low, medium or high affluence 7,8 . In 2014, 39% of young people were classified as living in a high affluence family, 39% in a medium affluence family and 17% in a low affluence family (Figure 2.3). Only 5% of children could not be classified. This classification is based on cut-offs devised for international comparisons, where Scotland is relatively affluent. PERCEIVED WEALTH Young people were asked ‘How well off do you think your family is?’ in order to obtain a subjective measure of family wealth. Overall, 37% of young people responded ‘average’, 37% ‘quite well off’ and 20% ‘very well off’. Only 6% of young people thought that their family was ‘not very’ or ‘not at all well off’ (Figure 2.4). The perception of family wealth changes with age. More 11-year olds describe their family as ‘very well off’ compared to 13- year olds, and 13-year olds are more likely to describe their family as ‘very well off’ than 15-year olds. Among 13- and 15-year olds, boys are more likely than girls to describe their family as very well off. Between 1998 and 2014, Scottish young people have become increasingly likely to describe their family as ‘very well off’, from 9% to 19% among girls, and from 12% to 22% among boys (Figure 2.5). COMMUNICATION BETWEEN PARENTS AND ADOLESCENTS Young people are more likely to find it easy to talk to their mother (82%) than to their father (66%) about things that really bother them. Easy communication with both parents declines with age for both boys and girls (Figures 2.6 and 2.7). Boys find it easier than girls to talk to their father at all three ages (Figure 2.6). Eleven and 15-year old boys and girls find it equally easy to communicate with their mother, but 13-year old boys are more likely than girls this age to report easy communication with their mother (Figure 2.7). Since 1990, there has been a steady increase in the proportion of boys and girls who find it easy to communicate with their father (Figure 2.8). Since 2010, girls have become more likely to find it easy to talk to their father (from 54% in 2010 to 59% in 2014), but boys have changed little over this period. There has been less change since 1990 in the proportion of young people finding it easy to talk to their mother (Figure 2.9). However, between 2010 and 2014, there was a slight increase in easy communication with mothers among boys (from 81% to 84%). Since 1990, there has been a persistent gender difference in ease of communication with fathers, but for communication with mothers, the gender difference is only present in 2014. FAMILY SUPPORT Pupils were asked four questions pertaining to family support, including items on emotional support, problem solving and decision making. The maximum family support score is 7 and the minimum 1. Figure 2.10 presents those with an average score of over 5.5 across these four items. Overall, 62% of 11-15 year olds report high family support. A gender difference is evident among 13-year olds only, such that boys this age are more likely to report high family support (66% versus 59% of girls). Perceived family support reduces with age. Whereas 72% of 11-year olds report high family support, this reduces to 51% among 15-year olds. 12
HEALTH BEHAVIOUR IN SCHOOL-AGED CHILDREN: WHO COLLABORATIVE CROSS-<strong>NATIONAL</strong> STUDY (HBSC) 2014 SURVEY IN SCOTLAND <strong>NATIONAL</strong> REPORT Figure 2.6: EASY TO TALK TO FATHER % who report that talking to father is easy 100% 80% 60% 40% 20% 0% 100% 80% 60% 40% 20% 0% 81 Figure 2.7: EASY TO TALK TO MOTHER % who report that talking to mother is easy 72 76 11 † 13 † 15 † Age (Years) 11 13 † 15 Age (Years) 58 91 89 86 80 65 Boys Boys 47 74 72 HBSC Scotland 2014 Survey Girls HBSC Scotland 2014 Survey Girls † Significant gender difference (p