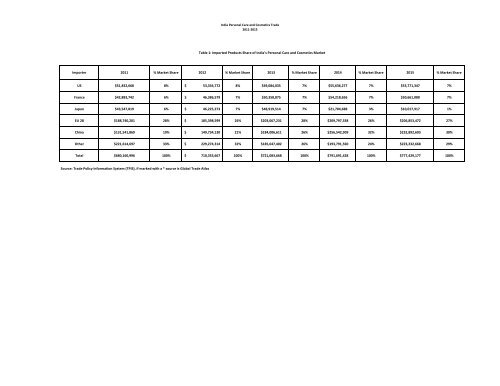
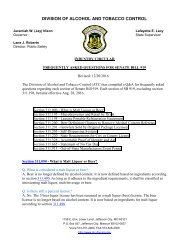
India <strong>Personal</strong> <strong>Care</strong> and <strong>Cosmetics</strong> Trade 2011-2015 Table 1: Imported Products Share of India's <strong>Personal</strong> <strong>Care</strong> and <strong>Cosmetics</strong> <strong>Market</strong> Importer 2011 % <strong>Market</strong> Share 2012 % <strong>Market</strong> Share 2013 % <strong>Market</strong> Share 2014 % <strong>Market</strong> Share 2015 % <strong>Market</strong> Share US $51,832,668 8% $ 53,334,772 8% $49,084,035 7% $55,636,277 7% $53,771,347 7% France $42,883,742 6% $ 46,386,579 7% $50,358,875 7% $54,218,656 7% $50,661,080 7% Japan $43,547,819 6% $ 46,225,273 7% $48,919,514 7% $21,704,688 3% $10,017,917 1% EU 28 $188,740,201 28% $ 185,398,599 26% $203,067,231 28% $209,797,338 26% $206,853,472 27% China $131,541,869 19% $ 149,734,130 21% $184,006,611 26% $256,542,909 32% $232,892,693 30% Other $221,614,697 33% $ 229,274,314 32% $185,647,402 26% $193,791,560 24% $223,232,668 29% Total $680,160,996 100% $ 710,353,667 100% $721,083,668 100% $791,691,428 100% $777,429,177 100% Source: Trade Policy Information System (TPIS), if marked with a * source is Global Trade Atlas
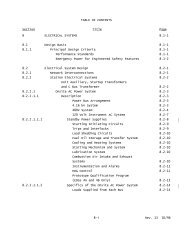
India <strong>Personal</strong> <strong>Care</strong> and <strong>Cosmetics</strong> Trade 2011-2015 HTS Code Description 2011 2012 2013 2014 2015 3304 Make-Up & Skin-<strong>Care</strong> Preparations Table 8: HS 34: Make Up Products, US Exports to India 3 YEAR AVG GROWTH CAGR 2010-2015 %Share of 2015 US Exports to India $12,378,347 $12,760,731 $13,024,691 $15,799,945 $12,645,095 -3% 0% 24% 330410 Lipstick, other prep $807,546 $1,494,640 $1,520,747 $1,403,252 $1,173,117 -23% 8% 2% 330420 Eye Make-Up $438,058 $374,167 $1,964,092 $221,085 $315,926 -84% -6% 1% 330430 330491 Manicure & Pedicure Preparations Powder Make-Up Or Skin <strong>Care</strong> Preparations $1,342,209 $1,111,045 $470,982 $743,055 $757,930 38% -11% 1% $379,825 $616,666 $468,649 $305,884 $247,888 -47% -8% 0% 330499 Beauty & Skin <strong>Care</strong> Prep $9,410,709 $9,164,213 $8,600,221 $13,126,669 $10,150,234 18% 2% 19% Source: Trade Policy Information System (TPIS), if marked with a * source is Global Trade Atlas Table 9: HS 35: Hair <strong>Care</strong> Products, US Exports to India HTS Code Description 2011 2012 2013 2014 2015 3 YEAR AVG GROWTH CAGR 2010-2015 %Share of 2015 US Exports to India 3305 Hair <strong>Care</strong> Products $1,433,516 $1,244,424 $1,864,194 $2,221,534 $2,747,003 47% 14% 5% 330510 Shampoo $571,990 $562,527 $539,049 $648,910 $641,369 19% 2% 1% 330520 Prep for Waiving and Straightening Hair $8,715 $19,645 $5,280 $4,050 $69,052 1208% 51% 0% 330530 Hair Lacquer $232,543 $16,642 $58,098 $26,521 $46,225 -20% -28% 0% 330590 Other Hair Products, inc. Color $620,268 $645,610 $1,261,767 $1,542,053 $1,990,357 58% 26% 4% Source: Trade Policy Information System (TPIS), if marked with a * source is Global Trade Atlas
- Page 1 and 2:
Asia Personal Care & Cosmetics Mark
- Page 3 and 4:
Table of Contents Country Guide: Au
- Page 5 and 6:
Overview of the Domestic Market Siz
- Page 7 and 8:
Table I: Total Imports of Personal
- Page 9 and 10:
interest, if the products are direc
- Page 11 and 12:
eached Australia, despite the count
- Page 13 and 14:
Cosmetics that make therapeutic cla
- Page 15 and 16:
Personal Care & Cosmetics Products
- Page 17 and 18:
Eye Shadow $15 $27 $48 $84 Mascara
- Page 19 and 20:
Baby and child specific products ar
- Page 21 and 22:
2015 Key Figures: • 63,241 visits
- Page 23 and 24:
• Stamped copies of power of atto
- Page 25 and 26:
HS Code Description Tariff VAT Cons
- Page 27 and 28:
Personal Care & Cosmetics Products:
- Page 29 and 30:
Hong Kong’s total imports, includ
- Page 31 and 32:
In developing a distribution strate
- Page 33 and 34:
In premium skincare products, consu
- Page 35 and 36:
Hong Kong. Other leading U.S. skinc
- Page 37 and 38:
3. “Dermo-skincare products” fo
- Page 39 and 40:
Personal Care & Cosmetics Products
- Page 41 and 42:
functional items to more advanced a
- Page 43 and 44:
market in India. For a new imported
- Page 45 and 46:
• Product Mix at the trade show:
- Page 47 and 48:
- The office of the Drug Controller
- Page 49 and 50:
Personal Care & Cosmetics Products
- Page 51 and 52:
Distributors notice that products w
- Page 53 and 54:
ecommended for substantial entry in
- Page 55 and 56:
Imports from Southeast Asian neighb
- Page 57 and 58:
- Issued by the manufacturer/princi
- Page 59 and 60:
products. From the viewpoint of not
- Page 61 and 62:
Fragrances, especially new product
- Page 63 and 64:
Shaving Prep 3.00 6.00 13.00 65.00
- Page 65 and 66:
Color Cosmetics Japanese women use
- Page 67 and 68:
Upon receipt of the manufacturing o
- Page 69 and 70:
Personal Care & Cosmetics Products
- Page 71 and 72:
3304 Make-Up & Skin-Care Preparatio
- Page 73 and 74:
The younger generation females tend
- Page 75 and 76:
The majority of the mass market cos
- Page 77 and 78:
27.44% of the Malaysian manicure or
- Page 79 and 80:
to the Muslim consumers should be a
- Page 81 and 82:
• Population changes will shape e
- Page 83 and 84:
United Kingdom $23,932 4% $25,649 4
- Page 85 and 86:
Personal Care & Cosmetics Products
- Page 87 and 88:
In addition to personal care produc
- Page 89 and 90:
purchases across all socio-economic
- Page 91 and 92:
Personal Care & Cosmetics Products
- Page 93 and 94:
Leading international brands contin
- Page 95 and 96:
moisturizer than a foundation and y
- Page 97 and 98:
2. Hair care preparations (shampoos
- Page 99 and 100:
There are no import or custom dutie
- Page 101 and 102:
2012 2013 2014 2015 Total Market Si
- Page 103 and 104:
Since the demand for new retail cha
- Page 105 and 106:
Overview of the Domestic Market US
- Page 107 and 108:
Annex
- Page 109 and 110:
COSMETICS MARKET READINESS ASSESSME
- Page 111 and 112: Product Function No Not required if
- Page 113 and 114: COSMETICS MARKET READINESS ASSESSME
- Page 115 and 116: COSMETICS MARKET READINESS ASSESSME
- Page 117 and 118: Product Notification Cosmetics prod
- Page 119 and 120: Percentage of Ingredients Claimed N
- Page 121 and 122: Product Sample Labeling Country of
- Page 123 and 124: ASEAN Table: Cosmetics Indonesia Ma
- Page 125 and 126: Australia Personal Care and Cosmeti
- Page 127 and 128: Australia Personal Care and Cosmeti
- Page 129 and 130: Australia Personal Care and Cosmeti
- Page 131 and 132: Australia Personal Care and Cosmeti
- Page 133 and 134: Australia Personal Care and Cosmeti
- Page 135 and 136: Australia Personal Care and Cosmeti
- Page 137 and 138: Table 2: China Imports of Personal
- Page 139 and 140: Table 4: China's Imports of Persona
- Page 141 and 142: Table 6: China's Imports of Persona
- Page 143 and 144: Table 8: China's Imports of Persona
- Page 145 and 146: HTS Code Description 2011 2012 2013
- Page 147 and 148: HONG KONG'S DOMESTIC EXPORTS BY PRO
- Page 149 and 150: HONG KONG'S IMPORTS BY PRODUCTS, 20
- Page 151 and 152: HONG KONG'S IMPORTS FROM THE U.S. B
- Page 153 and 154: HONG KONG'S IMPORTS FROM FRANCE BY
- Page 155 and 156: HONG KONG'S IMPORTS FROM KOREA (SOU
- Page 157 and 158: India Personal Care and Cosmetics T
- Page 159 and 160: India Personal Care and Cosmetics T
- Page 161: India Personal Care and Cosmetics T
- Page 165 and 166: Indonesia Personal Care and Cosmeti
- Page 167 and 168: Indonesia Personal Care and Cosmeti
- Page 169 and 170: Indonesia Personal Care and Cosmeti
- Page 171 and 172: Indonesia Personal Care and Cosmeti
- Page 173 and 174: Indonesia Personal Care and Cosmeti
- Page 175 and 176: Japan Personal Care and Cosmetics T
- Page 177 and 178: Japan Personal Care and Cosmetics T
- Page 179 and 180: Japan Personal Care and Cosmetics T
- Page 181 and 182: Japan Personal Care and Cosmetics T
- Page 183 and 184: Japan Personal Care and Cosmetics T
- Page 185 and 186: Japan Personal Care and Cosmetics T
- Page 187 and 188: Malaysia Personal Care and Cosmetic
- Page 189 and 190: Malaysia Personal Care and Cosmetic
- Page 191 and 192: Malaysia Personal Care and Cosmetic
- Page 193 and 194: Malaysia Personal Care and Cosmetic
- Page 195 and 196: Malaysia Personal Care and Cosmetic
- Page 197 and 198: Malaysia Personal Care and Cosmetic
- Page 199 and 200: Table 2: Philippines Imports of Per
- Page 201 and 202: Table 4: Philippines's Imports of P
- Page 203 and 204: Table 6: Philippines's Imports of P
- Page 205 and 206: Table 8: Philippines's Imports of P
- Page 207 and 208: Table 10: Imported Products Share o
- Page 209 and 210: Table 13: HS 37: Cosmetic & Toilet
- Page 211 and 212: Singapore Personal Care and Cosmeti
- Page 213 and 214:
Singapore Personal Care and Cosmeti
- Page 215 and 216:
Singapore Personal Care and Cosmeti
- Page 217 and 218:
Singapore Personal Care and Cosmeti
- Page 219 and 220:
Singapore Personal Care and Cosmeti
- Page 221 and 222:
South Korea Personal Care and Cosme
- Page 223 and 224:
South Korea Personal Care and Cosme
- Page 225 and 226:
South Korea Personal Care and Cosme
- Page 227 and 228:
South Korea Personal Care and Cosme
- Page 229 and 230:
South Korea Personal Care and Cosme
- Page 231 and 232:
South Korea Personal Care and Cosme
- Page 233:
1401 Constitution Avenue, NW Washin