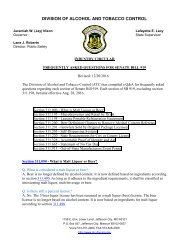
Table 9: Philippines's Imports of <strong>Personal</strong> <strong>Care</strong> and <strong>Cosmetics</strong> Products from Indonesia CAGR 2010- 3 Year Avg % Share of 2015 HTS Code Description 2011 2012 2013 2014 2015 2015 Growth Total Imports 3301 Essential Oils $66 $21,631 $45,286 $18,943 $10 -31% -100% 0% 330290 Fragrances & Substances Used as Inputs $10,852,733 $12,222,437 $12,122,772 $15,085,931 $15,671,062 NA 29% 15% 3303 Perfumes And Toilet Waters $883,140 $1,355,510 $1,195,888 $1,071,571 $2,162,096 20% 81% 2% 3304 Make-Up & Skin-<strong>Care</strong> Preparations $9,337,242 $8,758,924 $10,081,065 $10,767,659 $8,071,919 -3% -20% 8% 3305 Hair <strong>Care</strong> Products $13,127,891 $8,739,657 $7,940,165 $11,132,417 $6,855,742 -12% -14% 7% 3306 Oral & Dental Hygiene $15,951,114 $15,401,843 $17,426,131 $20,320,106 $13,230,133 -4% -24% 13% 3307 Cosmetic & Toilet Preparations, Inc Shaving, Bath Prep and Deodorants $3,950,490 $2,898,921 $4,717,533 $2,164,994 $1,929,011 -13% -59% 2% 3401 Soap & Other Products to Wash the Skin $14,385,075 $19,322,878 $19,626,216 $22,818,048 $22,707,654 10% 16% 22% 4803 Toilet, Facial Tissue, Towel Or Napkin Stock And Similar Paper, Cellulose Fiber Wadding And Webs, In $16,392,243 $21,500,038 $21,682,956 $21,580,252 $19,520,232 4% -10% 19% Rolls Or Sheets 4818 <strong>Personal</strong> <strong>Care</strong> Wipes, Diapers, Tampons $5,588,309 $4,646,148 $6,205,762 $5,834,667 $7,572,823 6% 22% 7% 5601 Sanitary Towels and Napkins $1,150,886 $749,069 $864,601 $1,255,297 $1,360,483 3% 57% 1% 9603 <strong>Personal</strong> <strong>Care</strong> Brushes: Nail, Shaving, Tooth, etc $107,278 $59,060 $521,100 $731,458 $765,530 48% 47% 1% 9605 Toilet Sets for <strong>Personal</strong> Travel $74 NA $501 $9,168 $4,371 126% 772% 0% 9619 Diapers and Fem Hygiene NA $1,509,833 $2,411,330 $2,084,384 $3,202,603 NA 33% 3% Total Imports $91,726,541 $97,185,949 $104,841,306 $114,874,895 $103,053,669 2% -2% 100% Source: Trade Policy Information System (TPIS), if marked with a * source is Global Trade Atlas
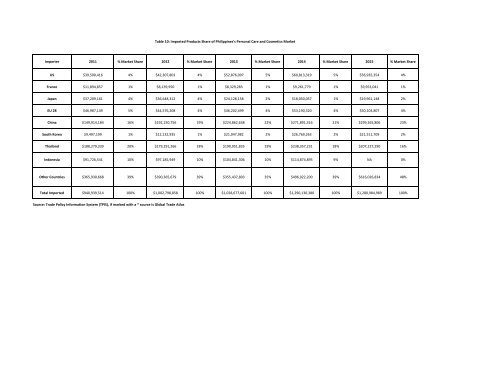
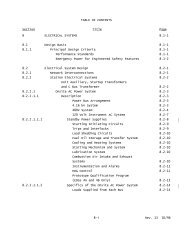
Table 10: Imported Products Share of Philippines's <strong>Personal</strong> <strong>Care</strong> and <strong>Cosmetics</strong> <strong>Market</strong> Importer 2011 % <strong>Market</strong> Share 2012 % <strong>Market</strong> Share 2013 % <strong>Market</strong> Share 2014 % <strong>Market</strong> Share 2015 % <strong>Market</strong> Share US $39,500,416 4% $42,307,803 4% $52,876,097 5% $60,813,319 5% $56,935,354 4% France $11,894,857 1% $8,139,950 1% $8,329,283 1% $9,261,779 1% $9,953,041 1% Japan $37,209,161 4% $36,648,312 4% $24,128,158 2% $18,050,057 1% $19,961,148 2% EU 28 $46,987,149 5% $44,576,208 4% $46,202,499 4% $53,190,320 4% $50,103,807 4% China $149,914,184 16% $192,150,756 19% $224,862,638 22% $271,891,316 21% $299,265,806 23% South Korea $9,497,199 1% $12,132,935 1% $21,047,982 2% $26,769,263 2% $21,511,709 2% Thailand $188,279,339 20% $179,291,266 18% $190,951,835 19% $238,357,231 18% $207,227,290 16% Indonesia $91,726,541 10% $97,185,949 10% $104,841,306 10% $114,874,895 9% NA 0% Other Countries $365,930,668 39% $390,365,679 39% $355,437,803 35% $496,922,200 39% $616,026,834 48% Total Imported $940,939,514 100% $1,002,798,858 100% $1,028,677,601 100% $1,290,130,380 100% $1,280,984,989 100% Source: Trade Policy Information System (TPIS), if marked with a * source is Global Trade Atlas
- Page 1 and 2:
Asia Personal Care & Cosmetics Mark
- Page 3 and 4:
Table of Contents Country Guide: Au
- Page 5 and 6:
Overview of the Domestic Market Siz
- Page 7 and 8:
Table I: Total Imports of Personal
- Page 9 and 10:
interest, if the products are direc
- Page 11 and 12:
eached Australia, despite the count
- Page 13 and 14:
Cosmetics that make therapeutic cla
- Page 15 and 16:
Personal Care & Cosmetics Products
- Page 17 and 18:
Eye Shadow $15 $27 $48 $84 Mascara
- Page 19 and 20:
Baby and child specific products ar
- Page 21 and 22:
2015 Key Figures: • 63,241 visits
- Page 23 and 24:
• Stamped copies of power of atto
- Page 25 and 26:
HS Code Description Tariff VAT Cons
- Page 27 and 28:
Personal Care & Cosmetics Products:
- Page 29 and 30:
Hong Kong’s total imports, includ
- Page 31 and 32:
In developing a distribution strate
- Page 33 and 34:
In premium skincare products, consu
- Page 35 and 36:
Hong Kong. Other leading U.S. skinc
- Page 37 and 38:
3. “Dermo-skincare products” fo
- Page 39 and 40:
Personal Care & Cosmetics Products
- Page 41 and 42:
functional items to more advanced a
- Page 43 and 44:
market in India. For a new imported
- Page 45 and 46:
• Product Mix at the trade show:
- Page 47 and 48:
- The office of the Drug Controller
- Page 49 and 50:
Personal Care & Cosmetics Products
- Page 51 and 52:
Distributors notice that products w
- Page 53 and 54:
ecommended for substantial entry in
- Page 55 and 56:
Imports from Southeast Asian neighb
- Page 57 and 58:
- Issued by the manufacturer/princi
- Page 59 and 60:
products. From the viewpoint of not
- Page 61 and 62:
Fragrances, especially new product
- Page 63 and 64:
Shaving Prep 3.00 6.00 13.00 65.00
- Page 65 and 66:
Color Cosmetics Japanese women use
- Page 67 and 68:
Upon receipt of the manufacturing o
- Page 69 and 70:
Personal Care & Cosmetics Products
- Page 71 and 72:
3304 Make-Up & Skin-Care Preparatio
- Page 73 and 74:
The younger generation females tend
- Page 75 and 76:
The majority of the mass market cos
- Page 77 and 78:
27.44% of the Malaysian manicure or
- Page 79 and 80:
to the Muslim consumers should be a
- Page 81 and 82:
• Population changes will shape e
- Page 83 and 84:
United Kingdom $23,932 4% $25,649 4
- Page 85 and 86:
Personal Care & Cosmetics Products
- Page 87 and 88:
In addition to personal care produc
- Page 89 and 90:
purchases across all socio-economic
- Page 91 and 92:
Personal Care & Cosmetics Products
- Page 93 and 94:
Leading international brands contin
- Page 95 and 96:
moisturizer than a foundation and y
- Page 97 and 98:
2. Hair care preparations (shampoos
- Page 99 and 100:
There are no import or custom dutie
- Page 101 and 102:
2012 2013 2014 2015 Total Market Si
- Page 103 and 104:
Since the demand for new retail cha
- Page 105 and 106:
Overview of the Domestic Market US
- Page 107 and 108:
Annex
- Page 109 and 110:
COSMETICS MARKET READINESS ASSESSME
- Page 111 and 112:
Product Function No Not required if
- Page 113 and 114:
COSMETICS MARKET READINESS ASSESSME
- Page 115 and 116:
COSMETICS MARKET READINESS ASSESSME
- Page 117 and 118:
Product Notification Cosmetics prod
- Page 119 and 120:
Percentage of Ingredients Claimed N
- Page 121 and 122:
Product Sample Labeling Country of
- Page 123 and 124:
ASEAN Table: Cosmetics Indonesia Ma
- Page 125 and 126:
Australia Personal Care and Cosmeti
- Page 127 and 128:
Australia Personal Care and Cosmeti
- Page 129 and 130:
Australia Personal Care and Cosmeti
- Page 131 and 132:
Australia Personal Care and Cosmeti
- Page 133 and 134:
Australia Personal Care and Cosmeti
- Page 135 and 136:
Australia Personal Care and Cosmeti
- Page 137 and 138:
Table 2: China Imports of Personal
- Page 139 and 140:
Table 4: China's Imports of Persona
- Page 141 and 142:
Table 6: China's Imports of Persona
- Page 143 and 144:
Table 8: China's Imports of Persona
- Page 145 and 146:
HTS Code Description 2011 2012 2013
- Page 147 and 148:
HONG KONG'S DOMESTIC EXPORTS BY PRO
- Page 149 and 150:
HONG KONG'S IMPORTS BY PRODUCTS, 20
- Page 151 and 152:
HONG KONG'S IMPORTS FROM THE U.S. B
- Page 153 and 154:
HONG KONG'S IMPORTS FROM FRANCE BY
- Page 155 and 156: HONG KONG'S IMPORTS FROM KOREA (SOU
- Page 157 and 158: India Personal Care and Cosmetics T
- Page 159 and 160: India Personal Care and Cosmetics T
- Page 161 and 162: India Personal Care and Cosmetics T
- Page 163 and 164: India Personal Care and Cosmetics T
- Page 165 and 166: Indonesia Personal Care and Cosmeti
- Page 167 and 168: Indonesia Personal Care and Cosmeti
- Page 169 and 170: Indonesia Personal Care and Cosmeti
- Page 171 and 172: Indonesia Personal Care and Cosmeti
- Page 173 and 174: Indonesia Personal Care and Cosmeti
- Page 175 and 176: Japan Personal Care and Cosmetics T
- Page 177 and 178: Japan Personal Care and Cosmetics T
- Page 179 and 180: Japan Personal Care and Cosmetics T
- Page 181 and 182: Japan Personal Care and Cosmetics T
- Page 183 and 184: Japan Personal Care and Cosmetics T
- Page 185 and 186: Japan Personal Care and Cosmetics T
- Page 187 and 188: Malaysia Personal Care and Cosmetic
- Page 189 and 190: Malaysia Personal Care and Cosmetic
- Page 191 and 192: Malaysia Personal Care and Cosmetic
- Page 193 and 194: Malaysia Personal Care and Cosmetic
- Page 195 and 196: Malaysia Personal Care and Cosmetic
- Page 197 and 198: Malaysia Personal Care and Cosmetic
- Page 199 and 200: Table 2: Philippines Imports of Per
- Page 201 and 202: Table 4: Philippines's Imports of P
- Page 203 and 204: Table 6: Philippines's Imports of P
- Page 205: Table 8: Philippines's Imports of P
- Page 209 and 210: Table 13: HS 37: Cosmetic & Toilet
- Page 211 and 212: Singapore Personal Care and Cosmeti
- Page 213 and 214: Singapore Personal Care and Cosmeti
- Page 215 and 216: Singapore Personal Care and Cosmeti
- Page 217 and 218: Singapore Personal Care and Cosmeti
- Page 219 and 220: Singapore Personal Care and Cosmeti
- Page 221 and 222: South Korea Personal Care and Cosme
- Page 223 and 224: South Korea Personal Care and Cosme
- Page 225 and 226: South Korea Personal Care and Cosme
- Page 227 and 228: South Korea Personal Care and Cosme
- Page 229 and 230: South Korea Personal Care and Cosme
- Page 231 and 232: South Korea Personal Care and Cosme
- Page 233: 1401 Constitution Avenue, NW Washin