EVALUATION
PA00MFK3
PA00MFK3

Create successful ePaper yourself
Turn your PDF publications into a flip-book with our unique Google optimized e-Paper software.
Approaches<br />
Quantitative<br />
Analysis<br />
Particulars<br />
method. This principle of ‘triangulation’ comes from the surveying profession,<br />
where one must take a minimum of three theodolite readings to be confident of<br />
the exact location of a reference point.<br />
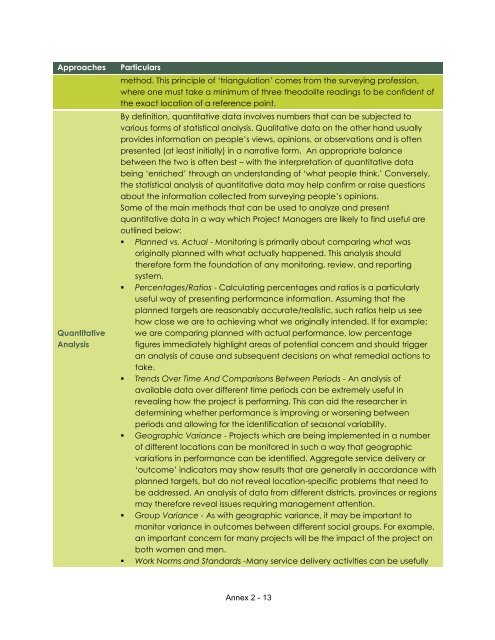
By definition, quantitative data involves numbers that can be subjected to<br />
various forms of statistical analysis. Qualitative data on the other hand usually<br />
provides information on people’s views, opinions, or observations and is often<br />
presented (at least initially) in a narrative form. An appropriate balance<br />
between the two is often best – with the interpretation of quantitative data<br />
being ‘enriched’ through an understanding of ‘what people think.’ Conversely,<br />
the statistical analysis of quantitative data may help confirm or raise questions<br />
about the information collected from surveying people’s opinions.<br />
Some of the main methods that can be used to analyze and present<br />
quantitative data in a way which Project Managers are likely to find useful are<br />
outlined below:<br />
• Planned vs. Actual - Monitoring is primarily about comparing what was<br />
originally planned with what actually happened. This analysis should<br />
therefore form the foundation of any monitoring, review, and reporting<br />
system.<br />
• Percentages/Ratios - Calculating percentages and ratios is a particularly<br />
useful way of presenting performance information. Assuming that the<br />
planned targets are reasonably accurate/realistic, such ratios help us see<br />
how close we are to achieving what we originally intended. If for example;<br />
we are comparing planned with actual performance, low percentage<br />
figures immediately highlight areas of potential concern and should trigger<br />
an analysis of cause and subsequent decisions on what remedial actions to<br />
take.<br />
• Trends Over Time And Comparisons Between Periods - An analysis of<br />
available data over different time periods can be extremely useful in<br />
revealing how the project is performing. This can aid the researcher in<br />
determining whether performance is improving or worsening between<br />
periods and allowing for the identification of seasonal variability.<br />
• Geographic Variance - Projects which are being implemented in a number<br />
of different locations can be monitored in such a way that geographic<br />
variations in performance can be identified. Aggregate service delivery or<br />
‘outcome’ indicators may show results that are generally in accordance with<br />
planned targets, but do not reveal location-specific problems that need to<br />
be addressed. An analysis of data from different districts, provinces or regions<br />
may therefore reveal issues requiring management attention.<br />
• Group Variance - As with geographic variance, it may be important to<br />
monitor variance in outcomes between different social groups. For example,<br />
an important concern for many projects will be the impact of the project on<br />
both women and men.<br />
• Work Norms and Standards -Many service delivery activities can be usefully<br />
Annex 2 - 13