2016 Annual Report For Web 7.3MB

Create successful ePaper yourself
Turn your PDF publications into a flip-book with our unique Google optimized e-Paper software.
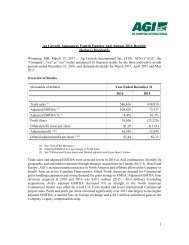
EBITDA AND ADJUSTED EBITDA<br />
[thousands of dollars] Year Ended December 31<br />
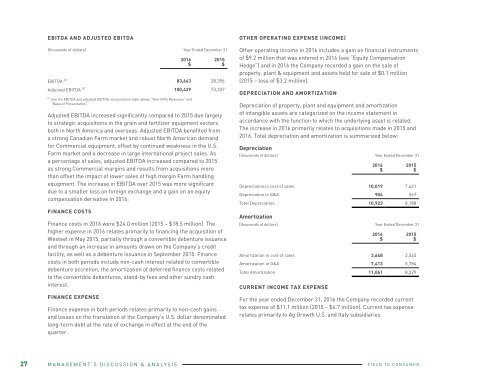
Adjusted EBITDA increased significantly compared to 2015 due largely<br />
to strategic acquisitions in the grain and fertilizer equipment sectors<br />
both in North America and overseas. Adjusted EBITDA benefited from<br />
a strong Canadian Farm market and robust North American demand<br />
for Commercial equipment, offset by continued weakness in the U.S.<br />
Farm market and a decrease in large international project sales. As<br />
a percentage of sales, adjusted EBITDA increased compared to 2015<br />
as strong Commercial margins and results from acquisitions more<br />
than offset the impact of lower sales of high margin Farm handling<br />
equipment. The increase in EBITDA over 2015 was more significant<br />
due to a smaller loss on foreign exchange and a gain on an equity<br />
compensation derivative in <strong>2016</strong>.<br />
FINANCE COSTS<br />
<strong>2016</strong><br />
$<br />
2015<br />
$<br />
EBITDA (1) 83,663 28,396<br />
Adjusted EBITDA (1) 100,429 73,337<br />
(1) See the EBITDA and adjusted EBITDA reconciliation table above, “Non-IFRS Measures” and<br />
“Basis of Presentation”.<br />
Finance costs in <strong>2016</strong> were $24.0 million (2015 – $18.5 million). The<br />
higher expense in <strong>2016</strong> relates primarily to financing the acquisition of<br />
Westeel in May 2015, partially through a convertible debenture issuance<br />
and through an increase in amounts drawn on the Company’s credit<br />
facility, as well as a debenture issuance in September 2015. Finance<br />
costs in both periods include non-cash interest related to convertible<br />
debenture accretion, the amortization of deferred finance costs related<br />
to the convertible debentures, stand-by fees and other sundry cash<br />
interest.<br />
OTHER OPERATING EXPENSE (INCOME)<br />
Other operating income in <strong>2016</strong> includes a gain on financial instruments<br />
of $9.2 million that was entered in <strong>2016</strong> (see “Equity Compensation<br />
Hedge”) and in <strong>2016</strong> the Company recorded a gain on the sale of<br />
property, plant & equipment and assets held for sale of $0.1 million<br />
(2015 – loss of $3.2 million).<br />
DEPRECIATION AND AMORTIZATION<br />
Depreciation of property, plant and equipment and amortization<br />
of intangible assets are categorized on the income statement in<br />
accordance with the function to which the underlying asset is related.<br />
The increase in <strong>2016</strong> primarily relates to acquisitions made in 2015 and<br />
<strong>2016</strong>. Total depreciation and amortization is summarized below:<br />
Depreciation<br />
[thousands of dollars] Year Ended December 31<br />
Amortization<br />
CURRENT INCOME TAX EXPENSE<br />
<strong>2016</strong><br />
$<br />
2015<br />
$<br />
Depreciation in cost of sales 10,019 7,621<br />
Depreciation in G&A 904 567<br />
Total Depreciation 10,923 8,188<br />
[thousands of dollars] Year Ended December 31<br />
<strong>2016</strong><br />
$<br />
2015<br />
$<br />
Amortization in cost of sales 3,648 2,545<br />
Amortization in G&A 7,413 5,784<br />
Total Amortization 11,061 8,329<br />
DEFERRED INCOME TAX EXPENSE<br />
<strong>For</strong> the year ended December 31, <strong>2016</strong>, the Company recorded deferred<br />
tax recovery of ($0.3) million (2015 –$1.6 million). Deferred tax recovery<br />
in <strong>2016</strong> relates to the increase of deferred tax assets plus a decrease<br />
in deferred tax liabilities that related to recognition of temporary<br />
differences between the accounting and tax treatment of depreciable<br />
assets, intangible assets and convertible debentures.<br />
Upon conversion to a corporation from an income trust in June 2009<br />
(the “Conversion”) the Company received certain tax attributes that<br />
may be used to offset tax otherwise payable in Canada. The Company’s<br />
Canadian taxable income is based on the results of its divisions<br />
domiciled in Canada, including the corporate office, and realized gains<br />
or losses on foreign exchange. <strong>For</strong> the year ended December 31, <strong>2016</strong>,<br />
the Company offset $0.5 million of Canadian tax otherwise payable<br />
(2015 - generated new net Canadian tax losses of ($0.7) million).<br />
Through the use of these attributes and since the date of Conversion<br />
a cumulative amount of $38.2 million has been utilized. Utilization of<br />
these tax attributes is recognized in deferred income tax expense on the<br />
Company’s income statement. As at December 31, <strong>2016</strong>, the balance<br />
sheet asset related to these unused attributes was $16.8 million.<br />
EFFECTIVE TAX RATE<br />
[thousands of dollars] Year Ended December 31<br />
<strong>2016</strong><br />
$<br />
2015<br />
$<br />
Current tax expense 11,122 4,722<br />
Deferred tax expense (260) (1,613)<br />
TOTAL TAX 10,862 3,109<br />
Profit (loss) before taxes 30,168 (22,120)<br />
Total tax % 36.0% (14.1%)<br />
PROFIT (LOSS) AND DILUTED PROFIT (LOSS) PER SHARE AND<br />
ADJUSTED DILUTED PROFIT (LOSS) PER SHARE<br />
In <strong>2016</strong> the Company reported profit of $19.3 million (2015 – loss of<br />
$25.2 million), basic profit per share of $1.31 (2015 – loss of $1.81) and<br />
a fully diluted profit per share of $1.29 (2015 – loss of $1.81).<br />
A reconciliation of adjusted profit per share is below:<br />
[thousands of dollars, other than per share data] Year Ended December 31<br />
<strong>2016</strong><br />
$<br />
2015<br />
$<br />
Profit as reported 19,306 (25,229)<br />
Diluted profit per share as reported 1.29 (1.81)<br />
Loss on foreign exchange 14,070 31,322<br />
Assets under review (353) 15,509<br />
Asset Impairment 7,839 0<br />
M&A expenses 3,018 5,405<br />
Contingent consideration expense 1,307 0<br />
Gain on financial instruments (9,210) 0<br />
Loss on sale of PP&E (114) 3,203<br />
Allowance for net Receivables 682 2,280<br />
Adjusted profit (1) 36,545 32,490<br />
Diluted adjusted profit per share (1) 2.44 2.33<br />
(1) See “Non-IFRS Measures”.<br />
FINANCE EXPENSE<br />
Finance expense in both periods relates primarily to non-cash gains<br />
and losses on the translation of the Company’s U.S. dollar denominated<br />
long-term debt at the rate of exchange in effect at the end of the<br />
quarter.<br />
<strong>For</strong> the year ended December 31, <strong>2016</strong> the Company recorded current<br />
tax expense of $11.1 million (2015 – $4.7 million). Current tax expense<br />
relates primarily to Ag Growth U.S. and Italy subsidiaries.<br />
The total tax percentage in 2015 and to a much lesser extent in <strong>2016</strong><br />
was impacted by items that were expensed for accounting purposes but<br />
were not deductible for tax purposes. These include non-cash losses<br />
on foreign exchange. See “Diluted profit per share and Diluted adjusted<br />
profit per share”.<br />
27 MANAGEMENT’S DISCUSSION & ANALYSIS<br />
FIELD TO CONSUMER<br />
<strong>2016</strong> ANNUAL REPORT<br />
MANAGEMENT’S DISCUSSION & ANALYSIS 28