

Multipactor in Low Pressure Gas and in ... - of Richard Udiljak
Multipactor in Low Pressure Gas and in ... - of Richard Udiljak
Multipactor in Low Pressure Gas and in ... - of Richard Udiljak

Create successful ePaper yourself
Turn your PDF publications into a flip-book with our unique Google optimized e-Paper software.
even though it may be sufficient from an eng<strong>in</strong>eer<strong>in</strong>g po<strong>in</strong>t <strong>of</strong> view. On<br />
the other h<strong>and</strong>, the higher order modes have a narrower phase-focus<strong>in</strong>g<br />
range (see below), which makes it difficult to compensate for e.g. <strong>in</strong>itial<br />
velocity spread, <strong>and</strong> thus a secondary yield <strong>of</strong> unity may not be sufficient<br />
to susta<strong>in</strong> a discharge. Consequently, an impact energy somewhat<br />
higher than the first cross-over po<strong>in</strong>t will be needed when construct<strong>in</strong>g<br />
the lower multipactor threshold for the higher order modes. This will<br />
be discussed further <strong>in</strong> the subsection “Effect <strong>of</strong> r<strong>and</strong>om emission delays<br />
<strong>and</strong> <strong>in</strong>itial velocity spread.”<br />
Voltage amplitude [V]<br />
10 4<br />
10 3<br />
10 2<br />
10 0<br />
10 1<br />
Frequency − Gap product [GHz⋅mm]<br />
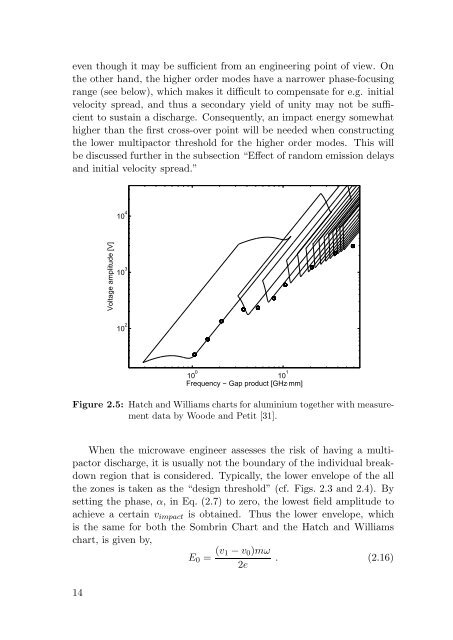
Figure 2.5: Hatch <strong>and</strong> Williams charts for alum<strong>in</strong>ium together with measurement<br />
data by Woode <strong>and</strong> Petit [31].<br />
When the microwave eng<strong>in</strong>eer assesses the risk <strong>of</strong> hav<strong>in</strong>g a multipactor<br />
discharge, it is usually not the boundary <strong>of</strong> the <strong>in</strong>dividual breakdown<br />
region that is considered. Typically, the lower envelope <strong>of</strong> the all<br />
the zones is taken as the “design threshold” (cf. Figs. 2.3 <strong>and</strong> 2.4). By<br />
sett<strong>in</strong>g the phase, α, <strong>in</strong> Eq. (2.7) to zero, the lowest field amplitude to<br />
achieve a certa<strong>in</strong> vimpact is obta<strong>in</strong>ed. Thus the lower envelope, which<br />
is the same for both the Sombr<strong>in</strong> Chart <strong>and</strong> the Hatch <strong>and</strong> Williams<br />
chart, is given by,<br />
E0 = (v1 − v0)mω<br />
. (2.16)<br />
2e<br />
14