

Multipactor in Low Pressure Gas and in ... - of Richard Udiljak
Multipactor in Low Pressure Gas and in ... - of Richard Udiljak
Multipactor in Low Pressure Gas and in ... - of Richard Udiljak

You also want an ePaper? Increase the reach of your titles
YUMPU automatically turns print PDFs into web optimized ePapers that Google loves.
Voltage [V]<br />
10 4<br />
10 3<br />
10 2<br />
10 0<br />
10 1<br />
Frequency − Gap product [GHz⋅mm]<br />
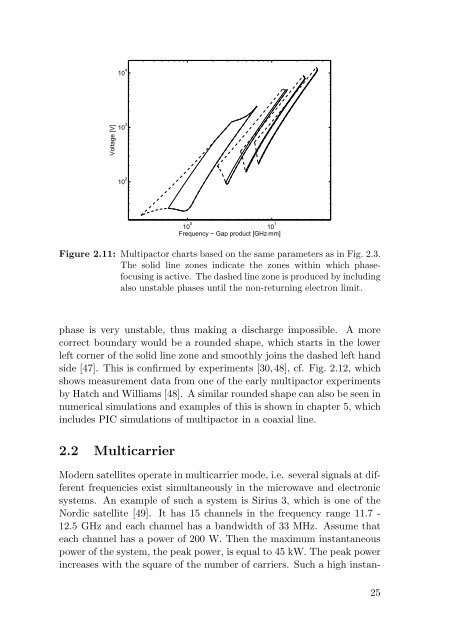
Figure 2.11: <strong>Multipactor</strong> charts based on the same parameters as <strong>in</strong> Fig. 2.3.<br />
The solid l<strong>in</strong>e zones <strong>in</strong>dicate the zones with<strong>in</strong> which phasefocus<strong>in</strong>g<br />
is active. The dashed l<strong>in</strong>e zone is produced by <strong>in</strong>clud<strong>in</strong>g<br />
also unstable phases until the non-return<strong>in</strong>g electron limit.<br />
phase is very unstable, thus mak<strong>in</strong>g a discharge impossible. A more<br />
correct boundary would be a rounded shape, which starts <strong>in</strong> the lower<br />
left corner <strong>of</strong> the solid l<strong>in</strong>e zone <strong>and</strong> smoothly jo<strong>in</strong>s the dashed left h<strong>and</strong><br />
side [47]. This is confirmed by experiments [30,48], cf. Fig. 2.12, which<br />
shows measurement data from one <strong>of</strong> the early multipactor experiments<br />
by Hatch <strong>and</strong> Williams [48]. A similar rounded shape can also be seen <strong>in</strong><br />
numerical simulations <strong>and</strong> examples <strong>of</strong> this is shown <strong>in</strong> chapter 5, which<br />
<strong>in</strong>cludes PIC simulations <strong>of</strong> multipactor <strong>in</strong> a coaxial l<strong>in</strong>e.<br />
2.2 Multicarrier<br />
Modern satellites operate <strong>in</strong> multicarrier mode, i.e. several signals at different<br />
frequencies exist simultaneously <strong>in</strong> the microwave <strong>and</strong> electronic<br />
systems. An example <strong>of</strong> such a system is Sirius 3, which is one <strong>of</strong> the<br />
Nordic satellite [49]. It has 15 channels <strong>in</strong> the frequency range 11.7 -<br />
12.5 GHz <strong>and</strong> each channel has a b<strong>and</strong>width <strong>of</strong> 33 MHz. Assume that<br />
each channel has a power <strong>of</strong> 200 W. Then the maximum <strong>in</strong>stantaneous<br />
power <strong>of</strong> the system, the peak power, is equal to 45 kW. The peak power<br />
<strong>in</strong>creases with the square <strong>of</strong> the number <strong>of</strong> carriers. Such a high <strong>in</strong>stan-<br />
25